Watershed is a beautiful blue that looks as fantastic as it is useful. But what if you want to change the appearance of Watershed to match your brand? This guide walks you through how using the Appearance section of Settings.
- User Types
- Only Global Admins can access these features.
- Pricing
- Available on paid plans (Analyst, CLO, and Enterprise).
- Expertise
- Only expert users should use this feature.
Heads up: Test all appearance changes in your Sandbox account first!
Accessing Appearance Settings
To access Appearance Settings, go to Appearance on the Settings menu: 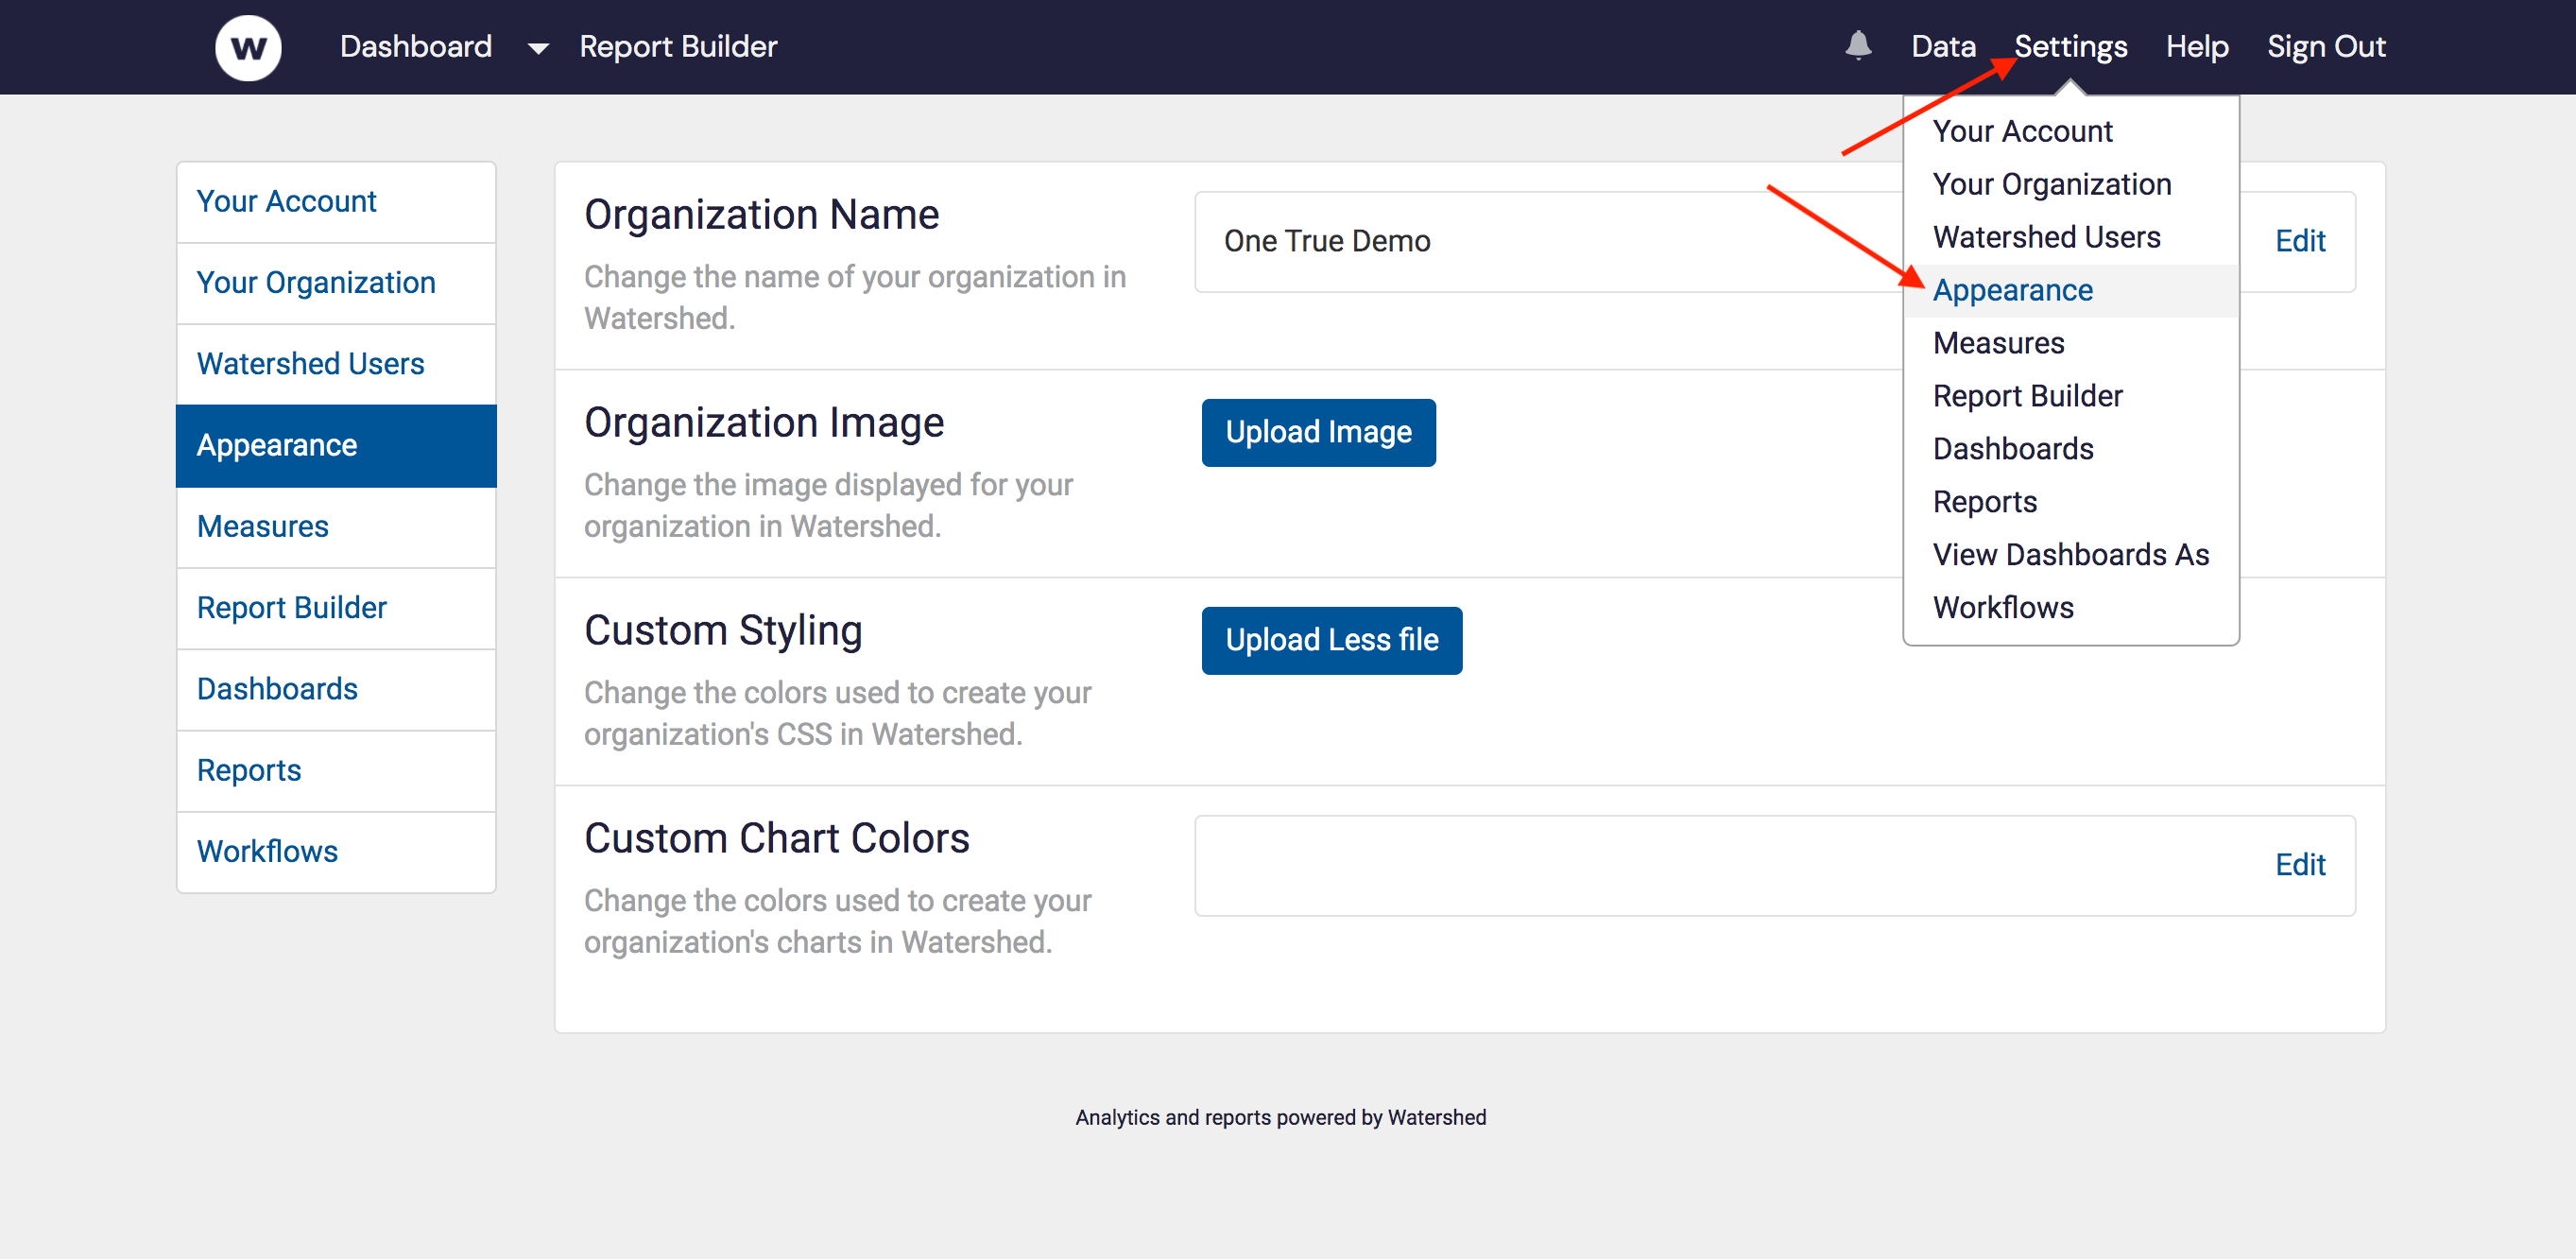
Appearance Settings has 4 main customization options: Organization Name, Organization Image, Custom Styling, and Custom Chart Colors.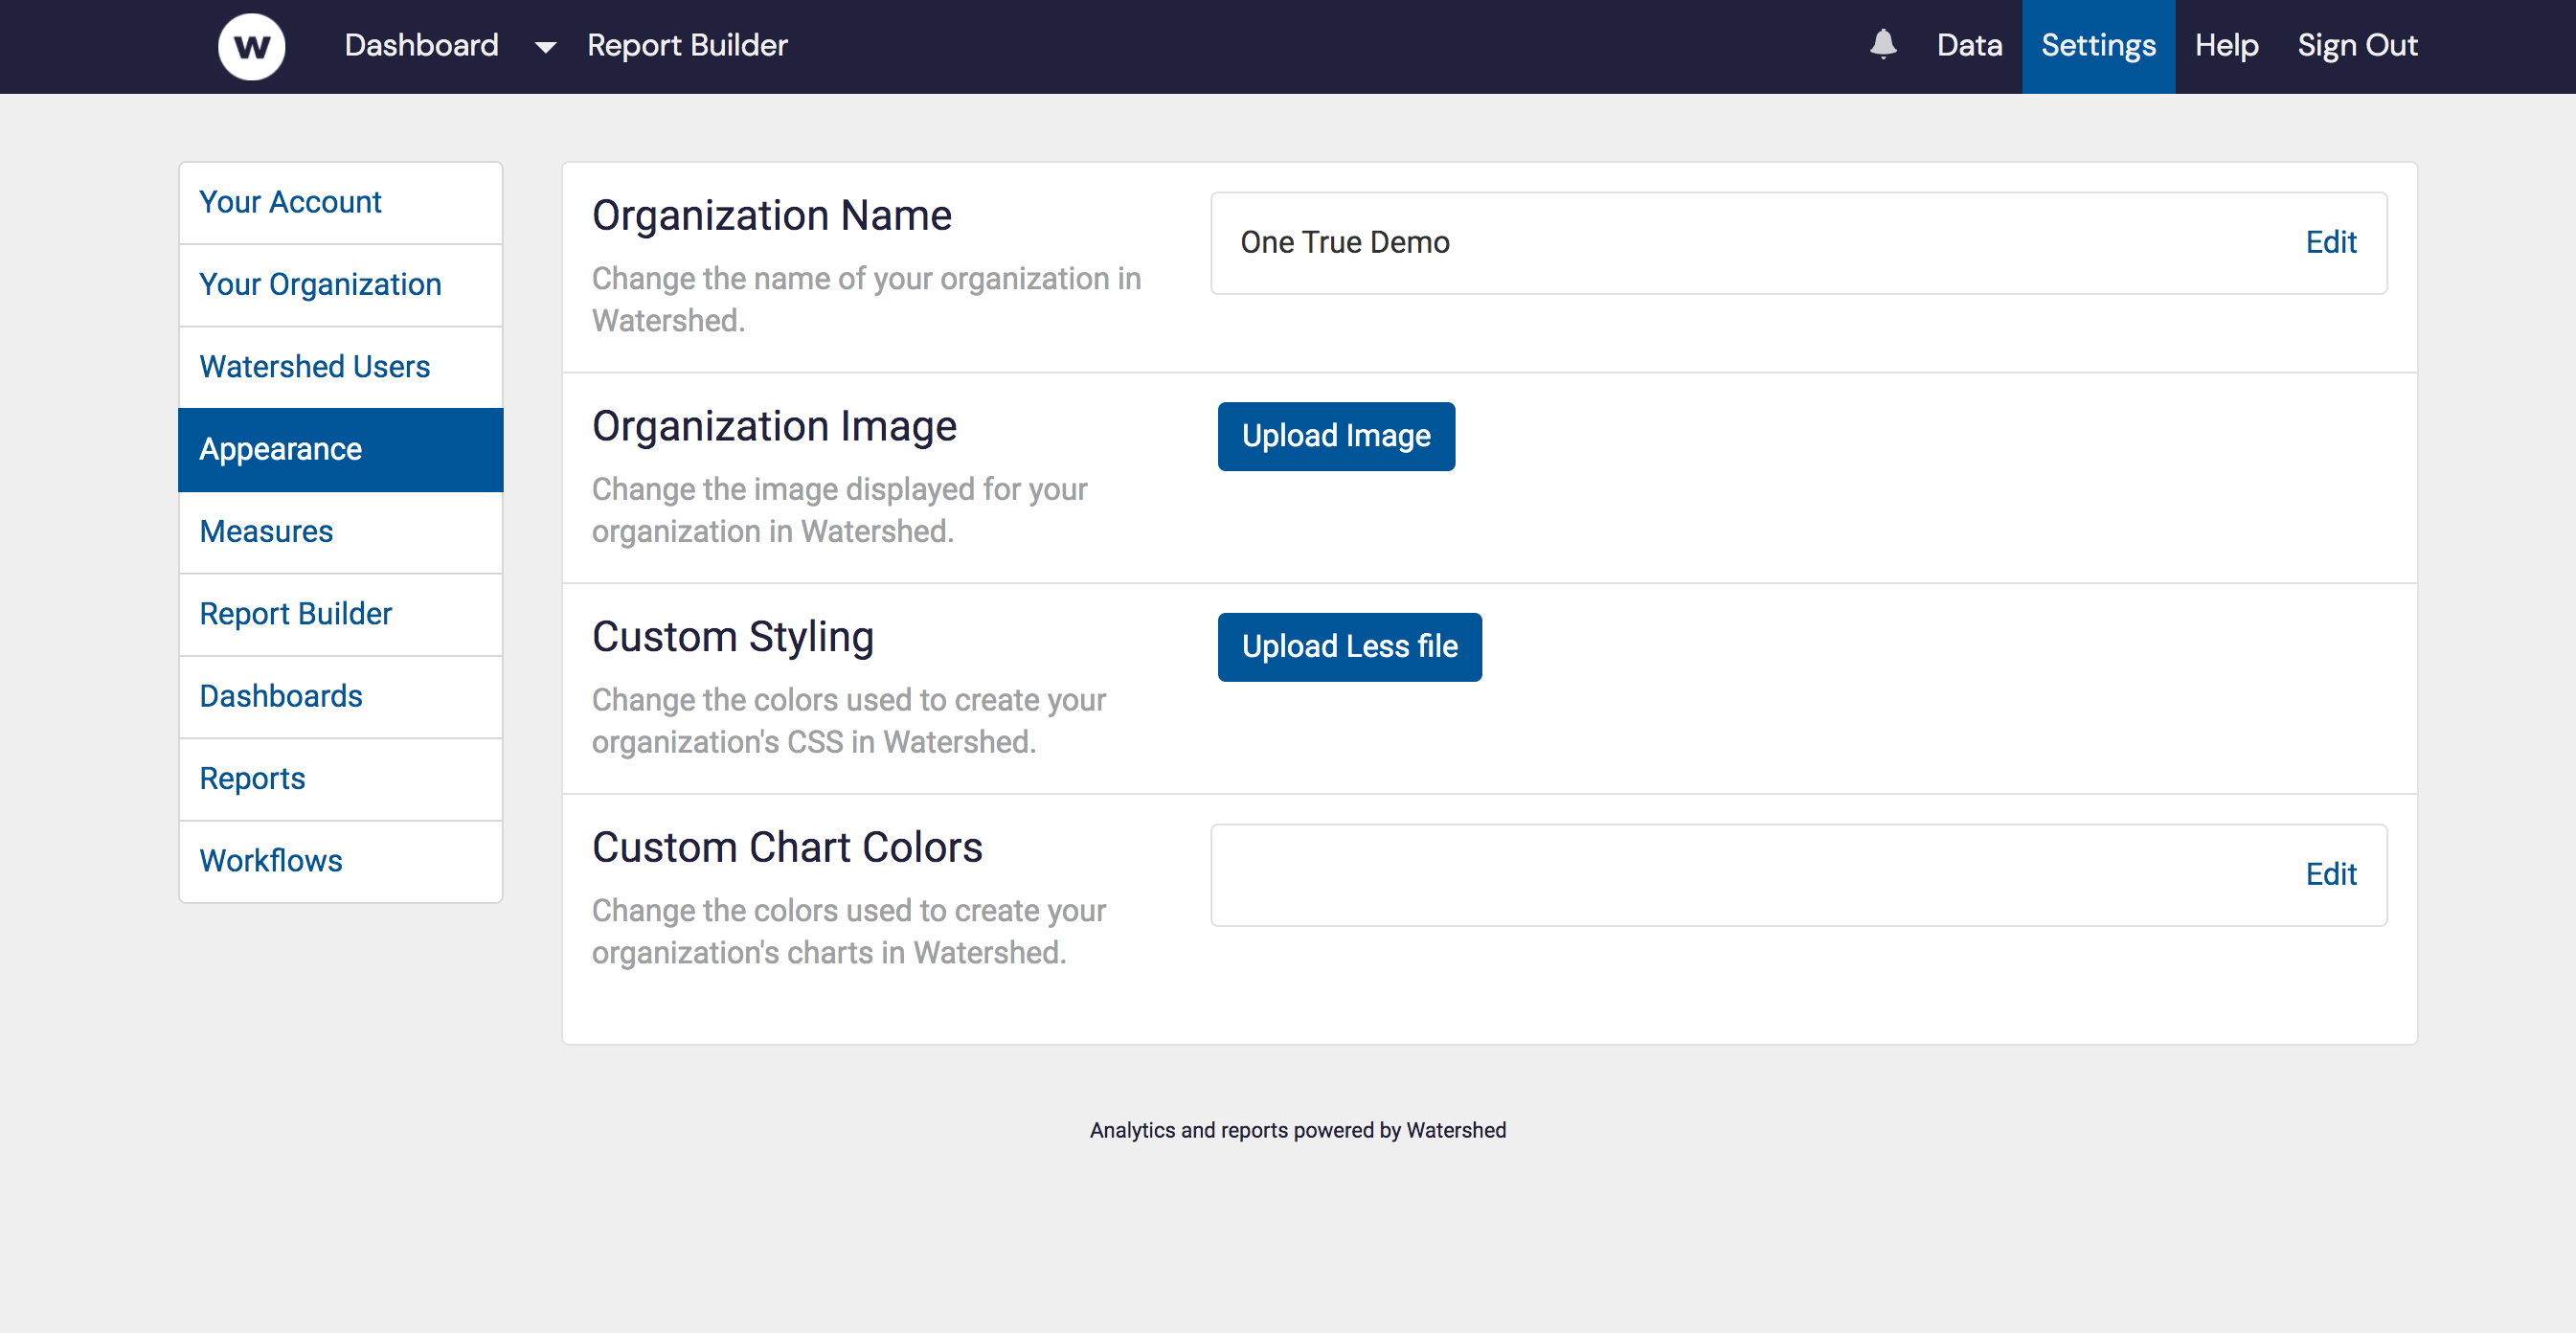
Organization Name
The first option, Organization Name, changes the name of your account: You'll only see the organization name if logged in as a user that has access to multiple organizations.
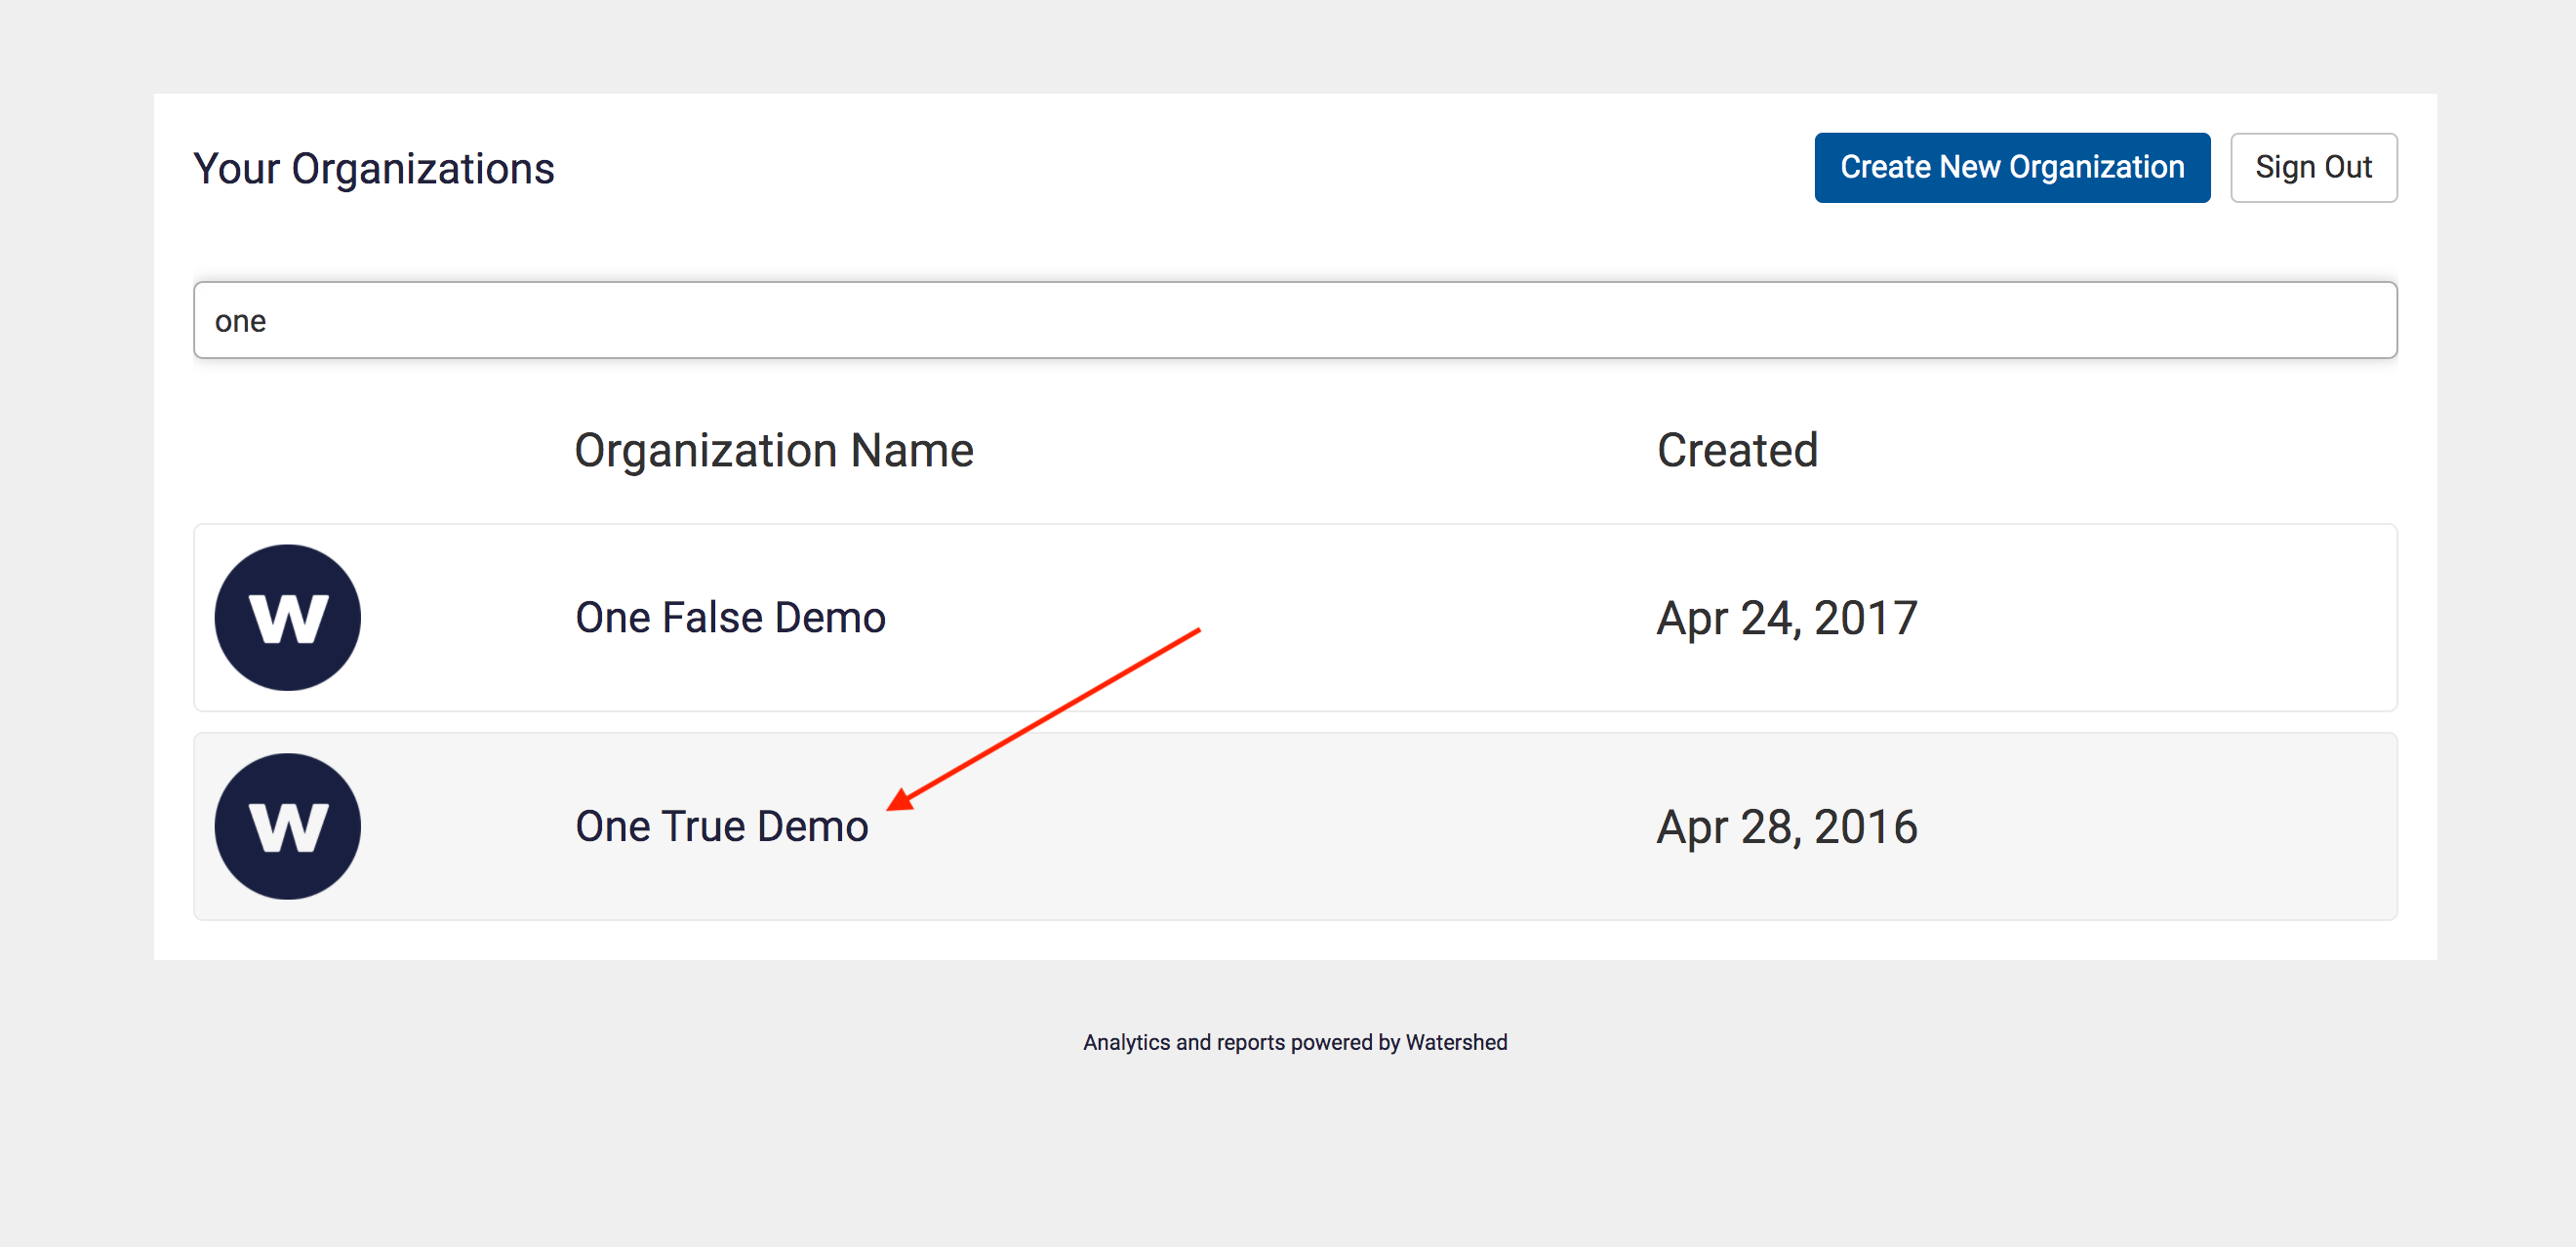
Organization Image
The Organization Image option controls the main logo in all accounts:
By default, it's the Watershed logo, but to upload a your own organization's logo click the Upload Image button and follow the steps.
Please note: The ideal logo file:
- is a horizontally-oriented PNG file.
- has a transparent background.
- is 400 pixels wide.
- is no more than 200 pixels tall.
Custom Styling
The Custom Styling option allows you to completely transform the appearance of Watershed.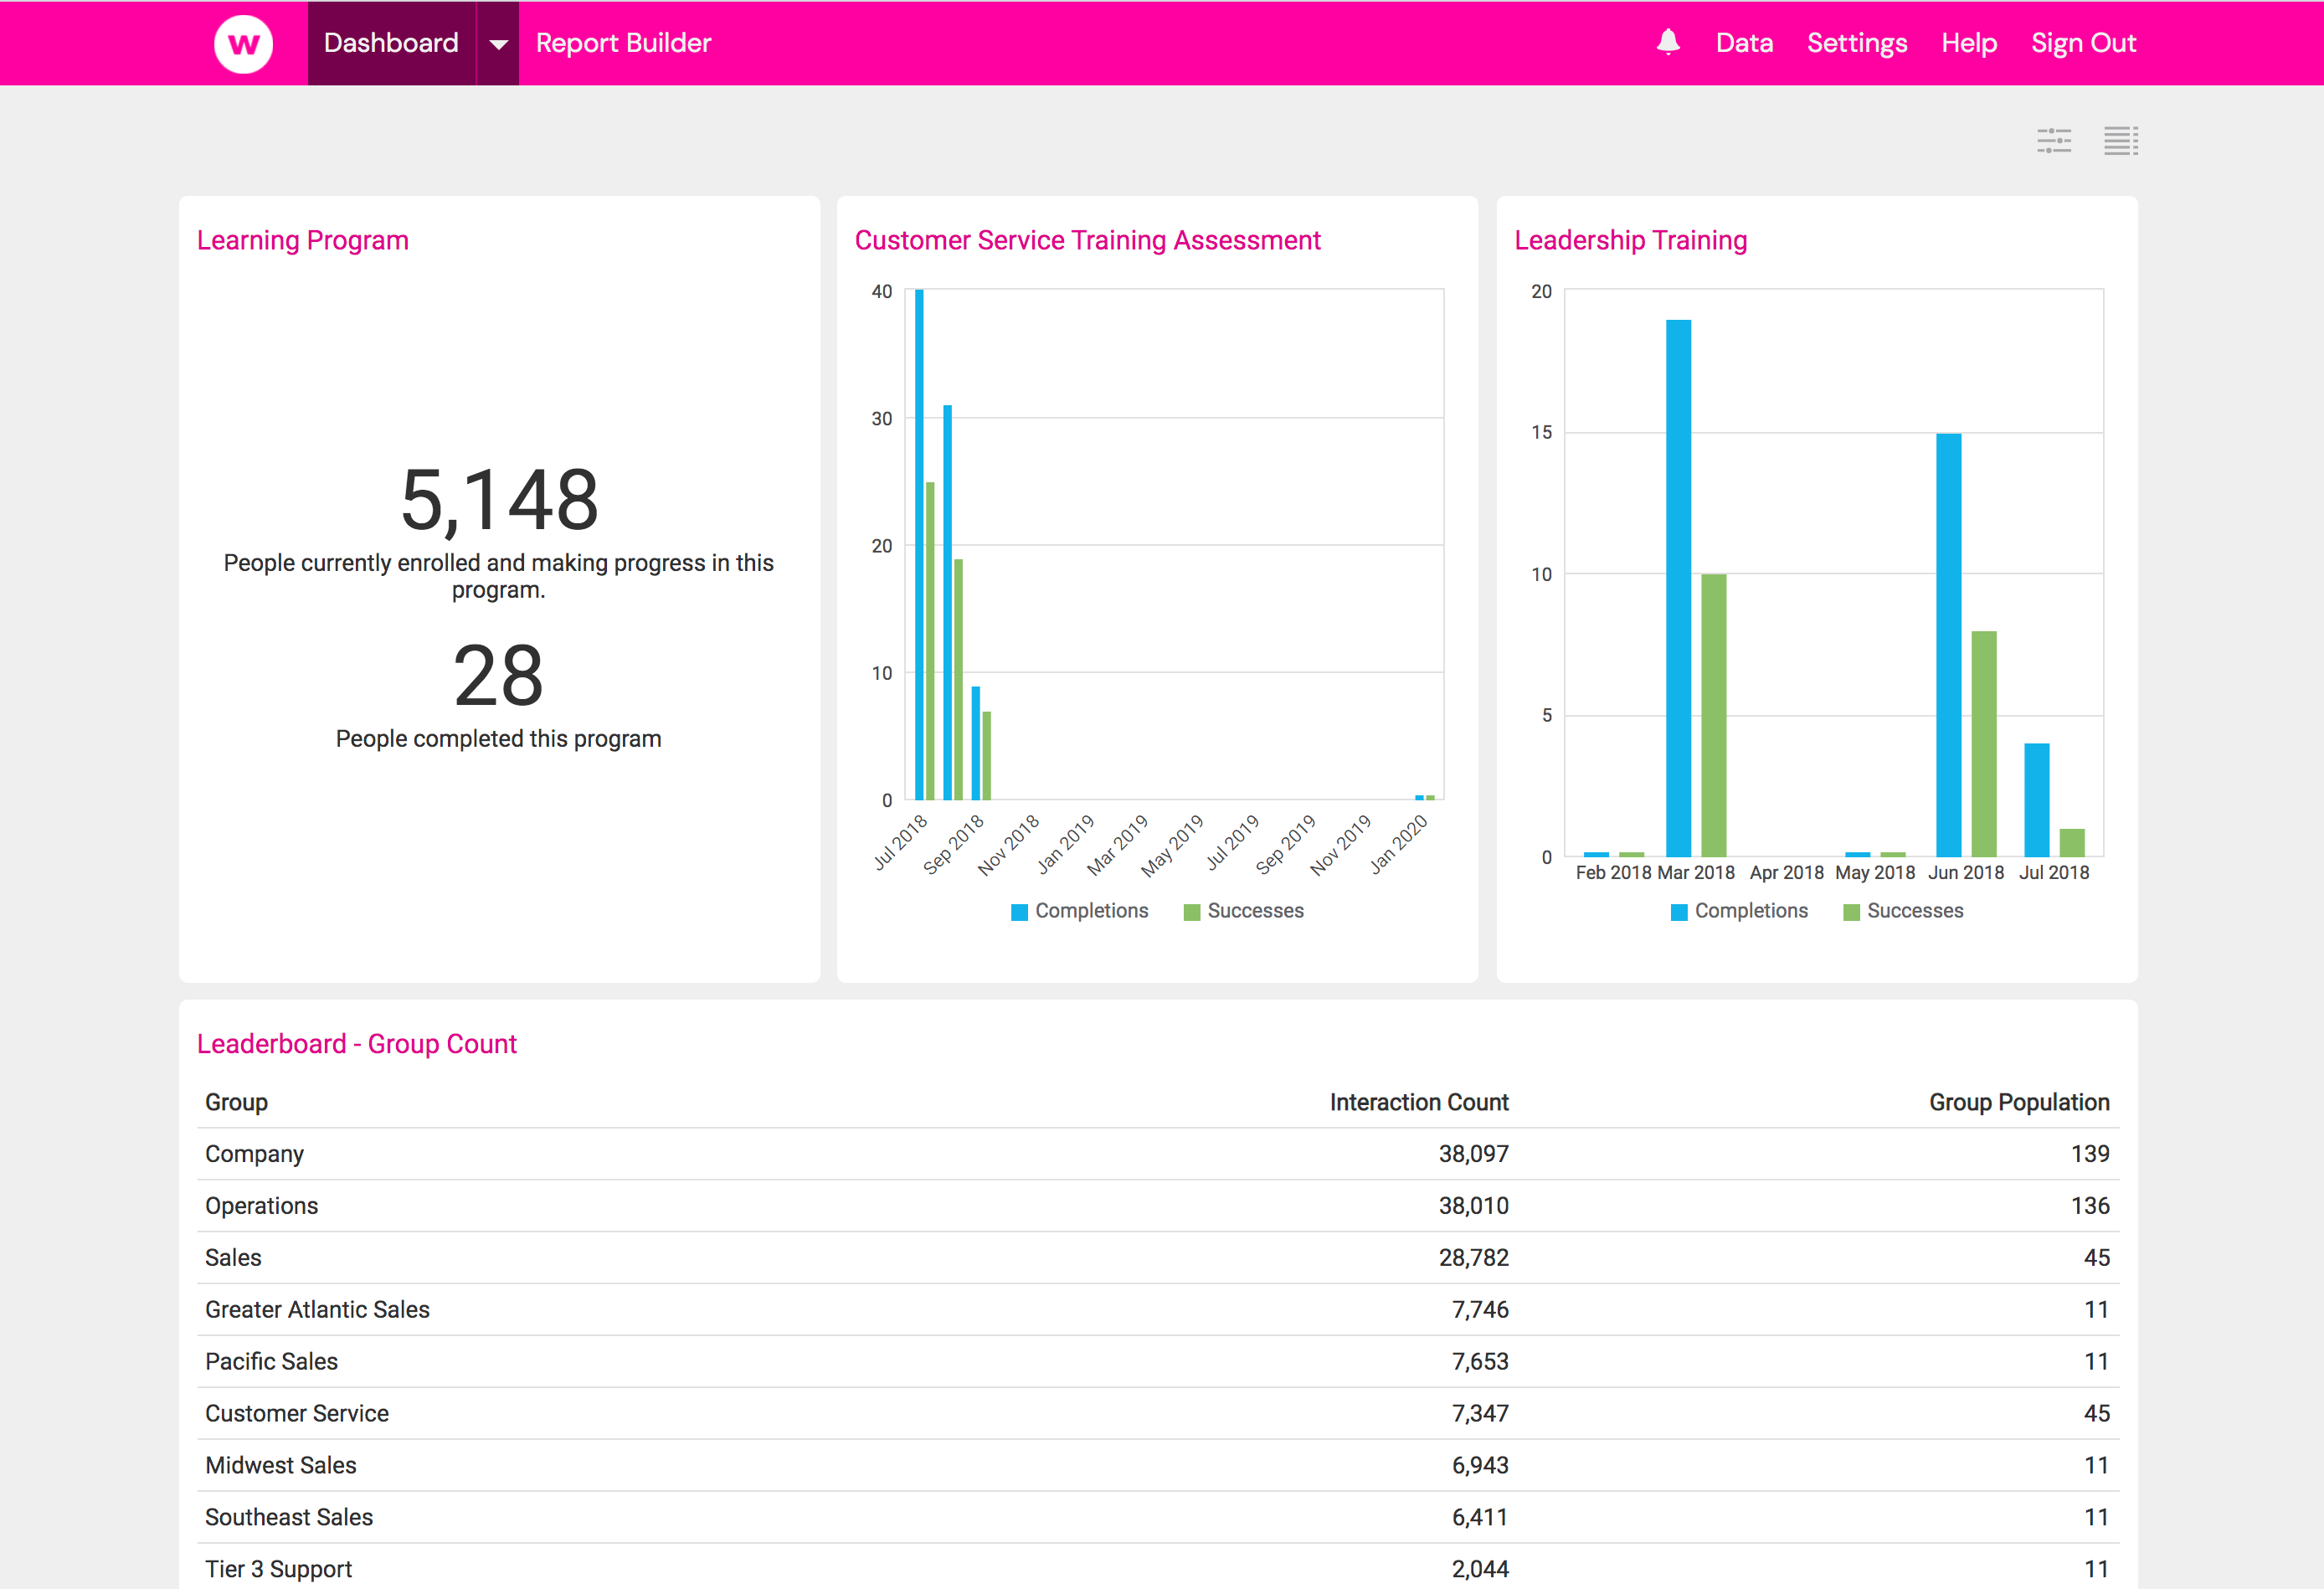
To change the appearance of Watershed's interface, you can upload a watershed.less file that defines the colors to use.
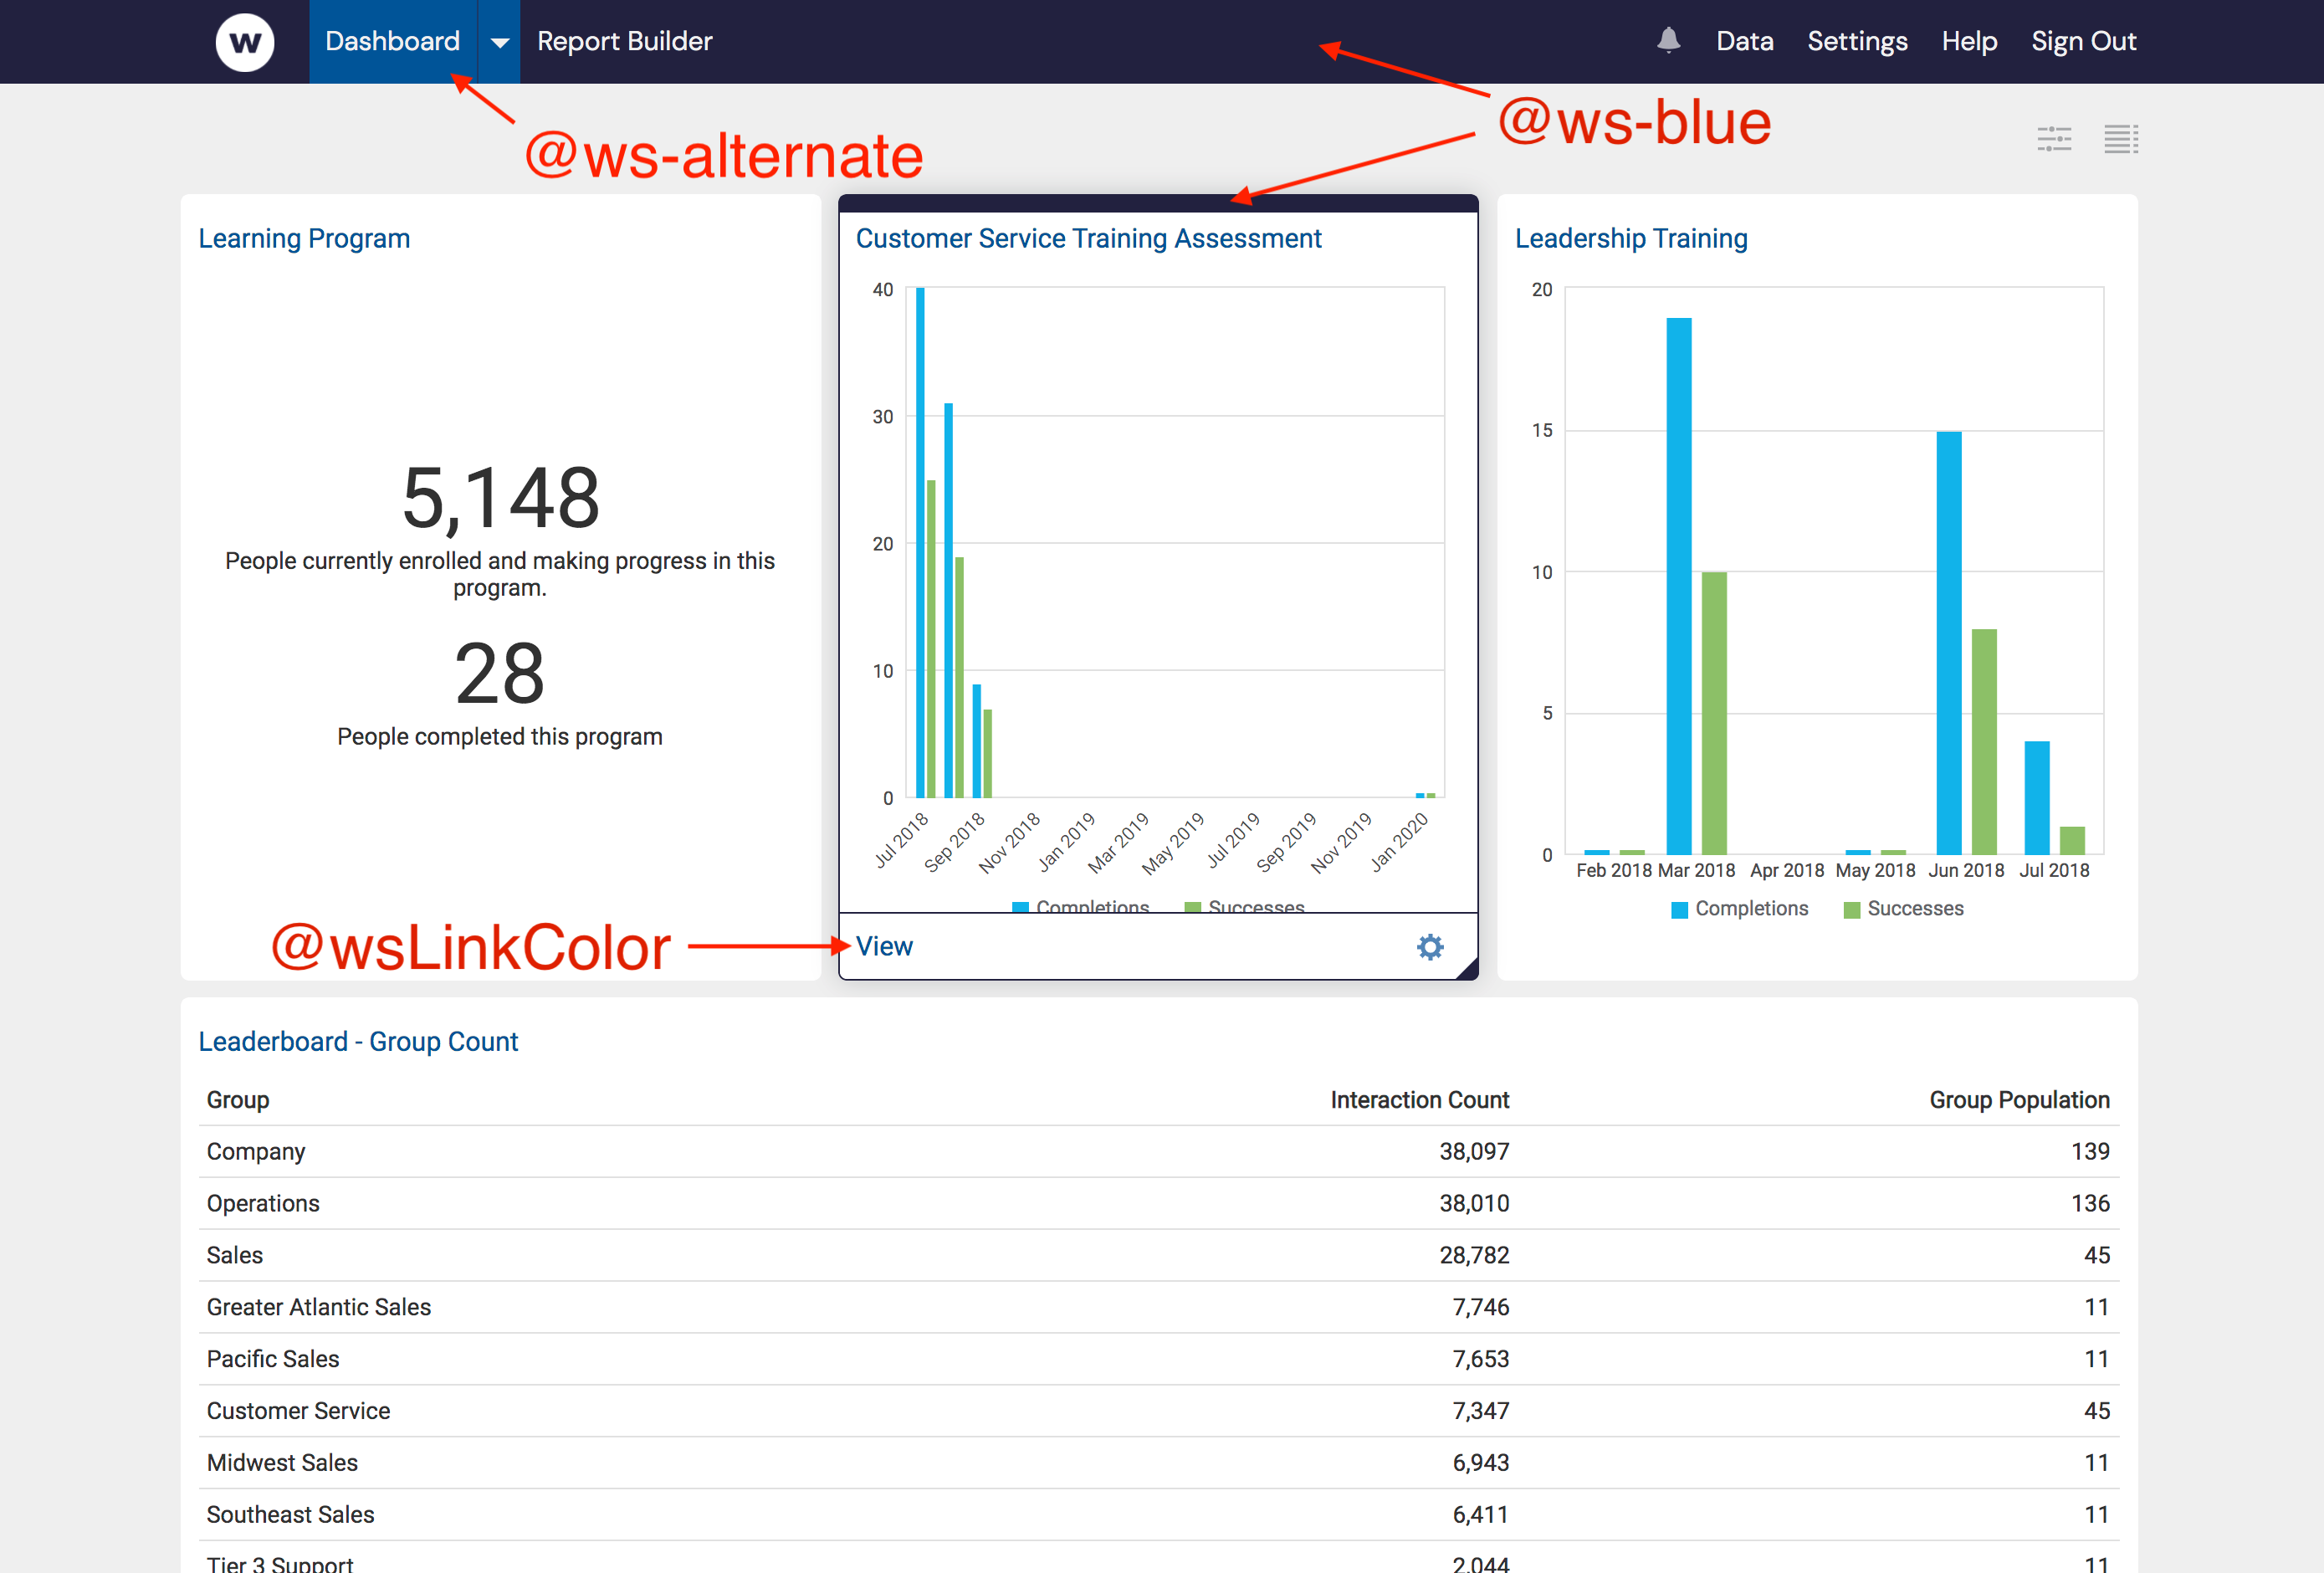
Create this file in a text editor by copying and editting the example below then saving the file as watershed.less (or another filename with the .less extension). You should replace the Watershed default of shades of blue with hexadecimal values from your brand palette. For example, saving and uploading the following code will turn Watershed pink as seen in the screenshot above!
@ws-blue: #ff00aa;
@ws-alternate: #800055;
@ws-blue-light: #ffb3e6;
@wsLinkColor: #e60099;
Some places these colors are used include:
- The blue (@ws-blue) is used as the main primary color.
- The alternate (@ws-alternate) is used as a secondary color to highlight selected menu items.
- The light blue (@ws-blue-light) is used rarely as a border or background color. It's not shown in the screenshot below.
- The last line (@wsLinkColor) controls the color of links. If you don't specify, the value of @ws-alternate will be used by default.
To upload a watershed.less file, click the Upload Less File button and find the file on your computer:
Please note: It is not possible to customize report colors in the watershed.less file. See below for chart color customization.
Once the watershed.less file is uploaded, it will take some time for the changes to be reset in your browser’s cache. We recommend that you clear your browser’s cache, log out and back in, and then refresh your browser until you see the results.
It's also possible to customize @black @white @gray-dark @gray @gray-light @gray-lighter @gray-lightest @gray-almost-white and @red. @red is used in error and warning messages.
Custom Chart Colors
The Custom Chart Colors option allows you to set the colors on Watershed's charts and graphs. Colors can be set at the organization, measure and report level.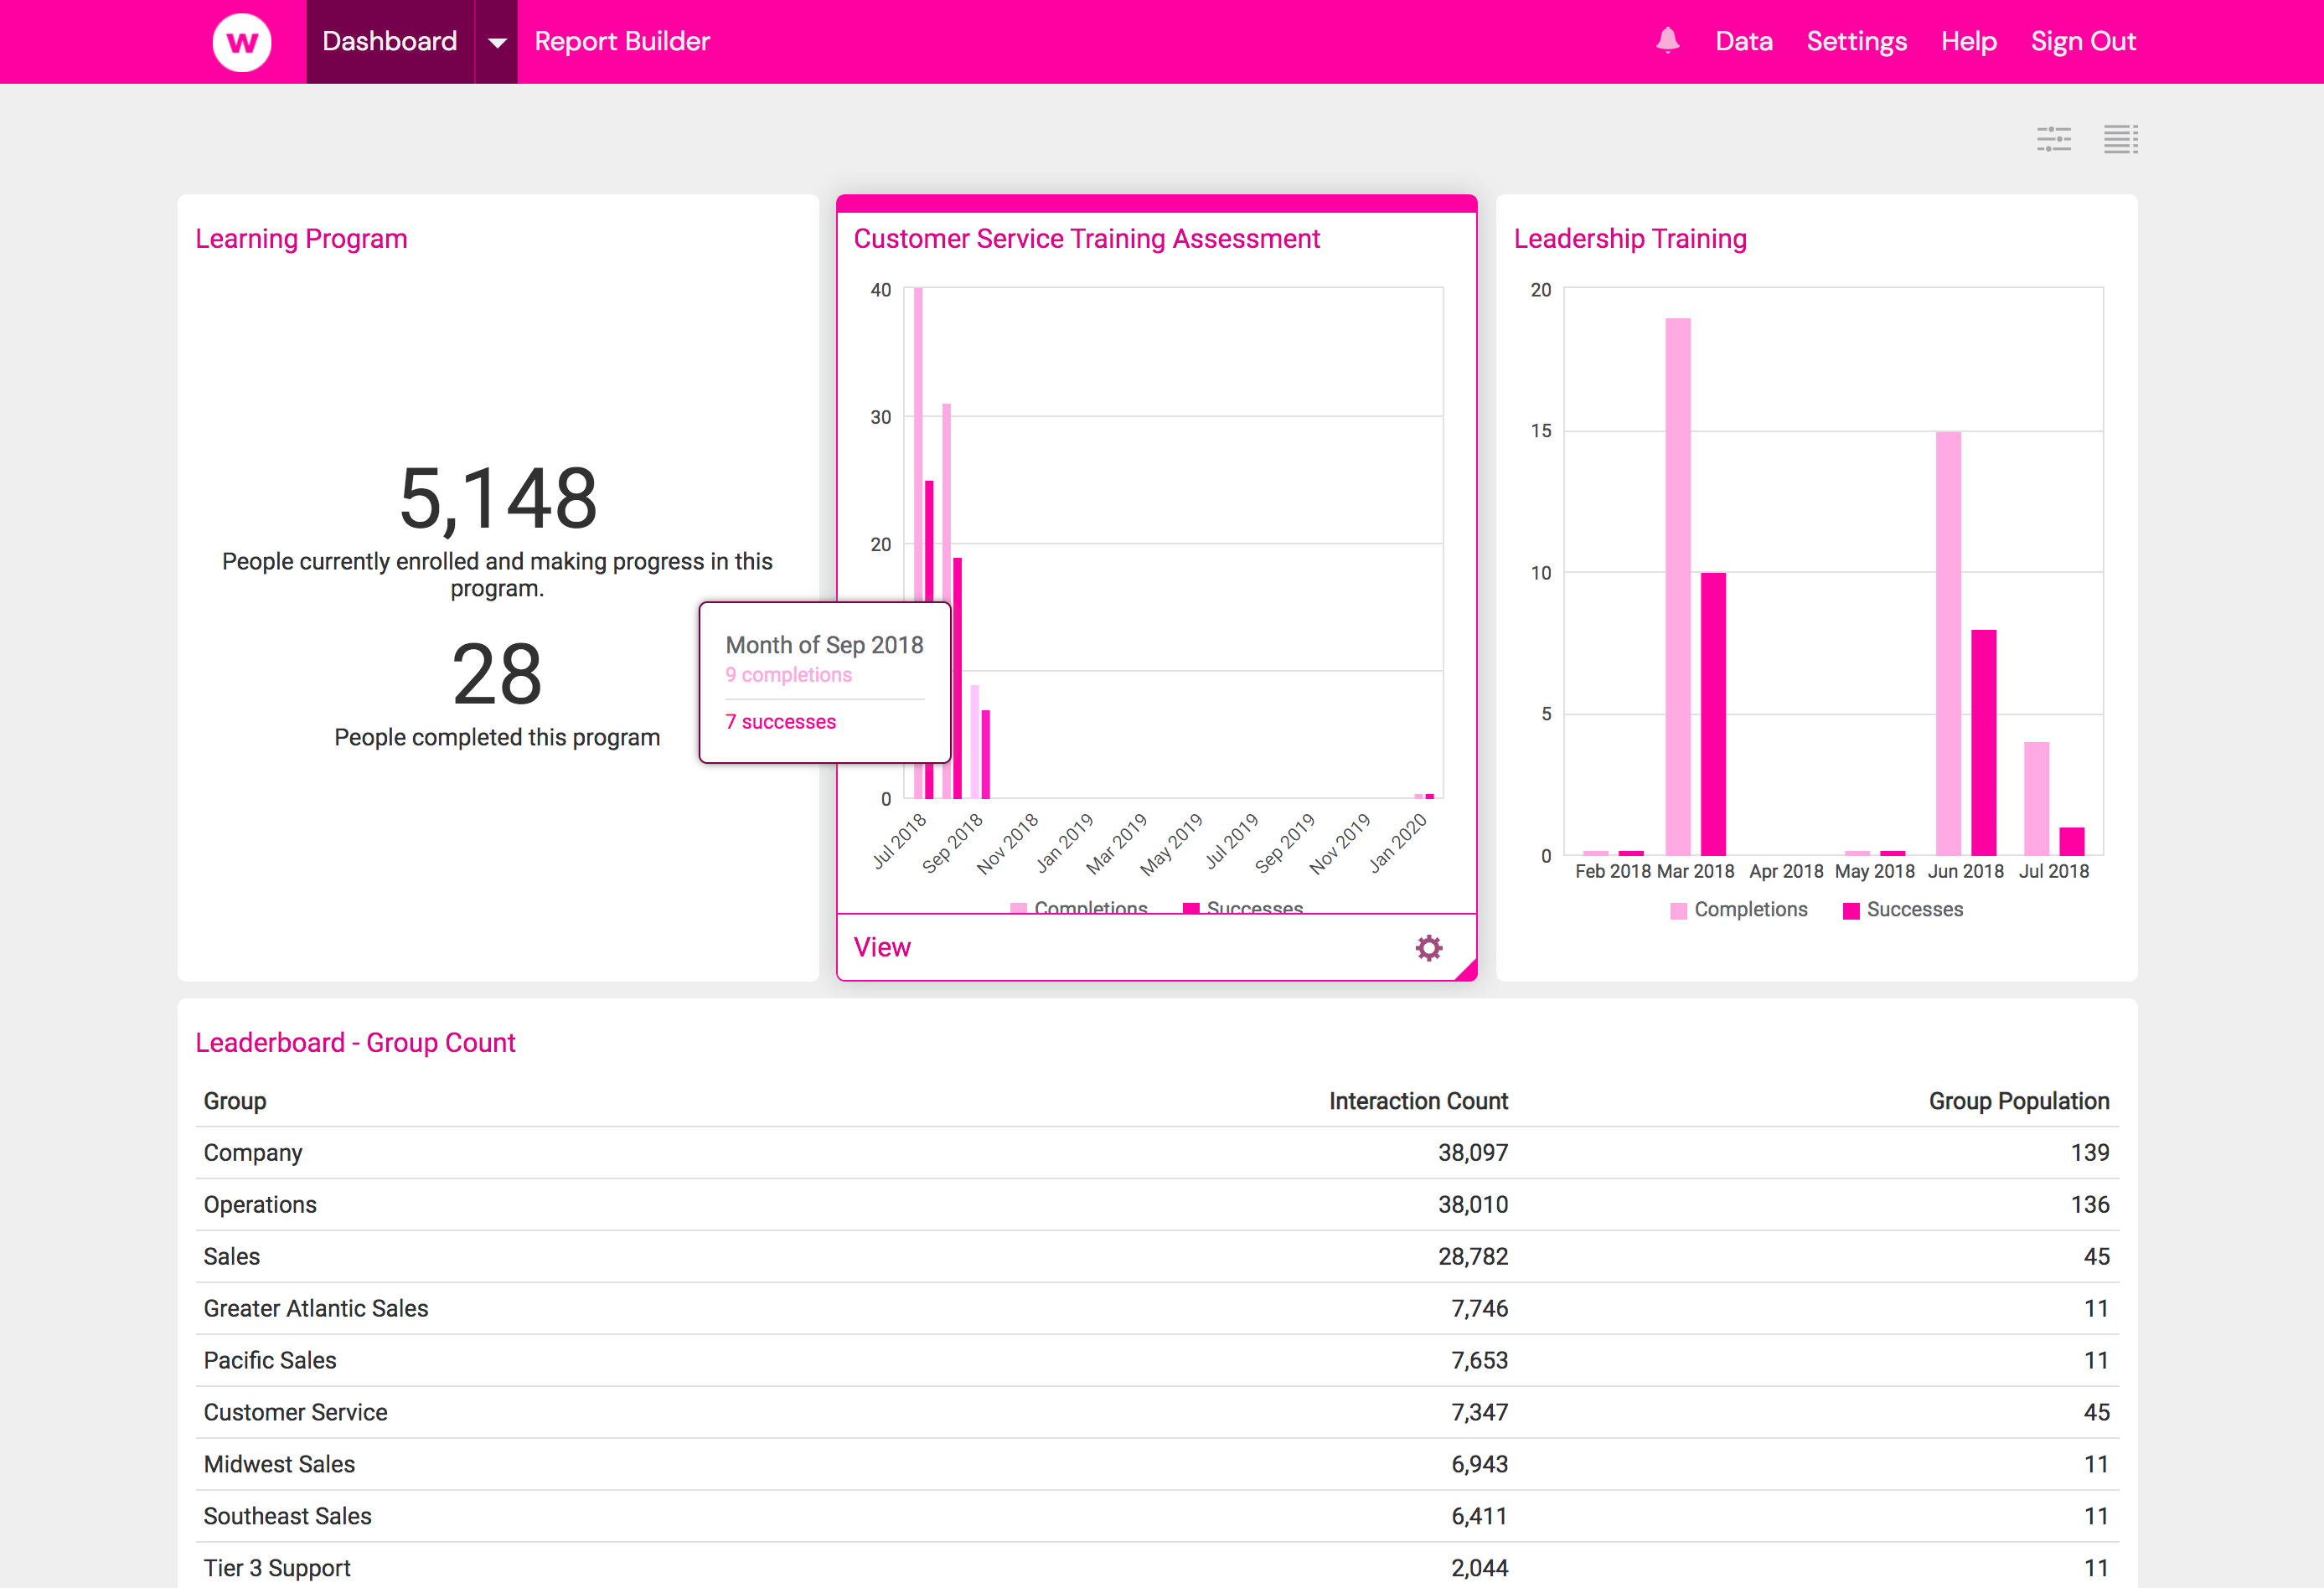
Setting Organization Chart Colors
The custom chart colors are controlled by adding hexadecimal values to the Custom Chart Colors text box. If the Custom Chart Colors box is empty, Watershed will use the default organization chart colors. First click Edit in the text box:
In the box, inside the square brackets, enter a series of CSS color values and then click Save. The list of colors needs to be separated in commas. The example below is a list of 5 different shades of pink:
#ffb3e6, #ff00aa, #800055, #330022, #e60099

Once saved these colors will be previewed below and used as the default colors on reports.
To return chart colors to default, save the Custom Chart Colors text box with just square brackets.
Please note: If a report uses more colors than those specified, it will default to the default Watershed colors once the specified colors have been used.
Setting Measure Colors
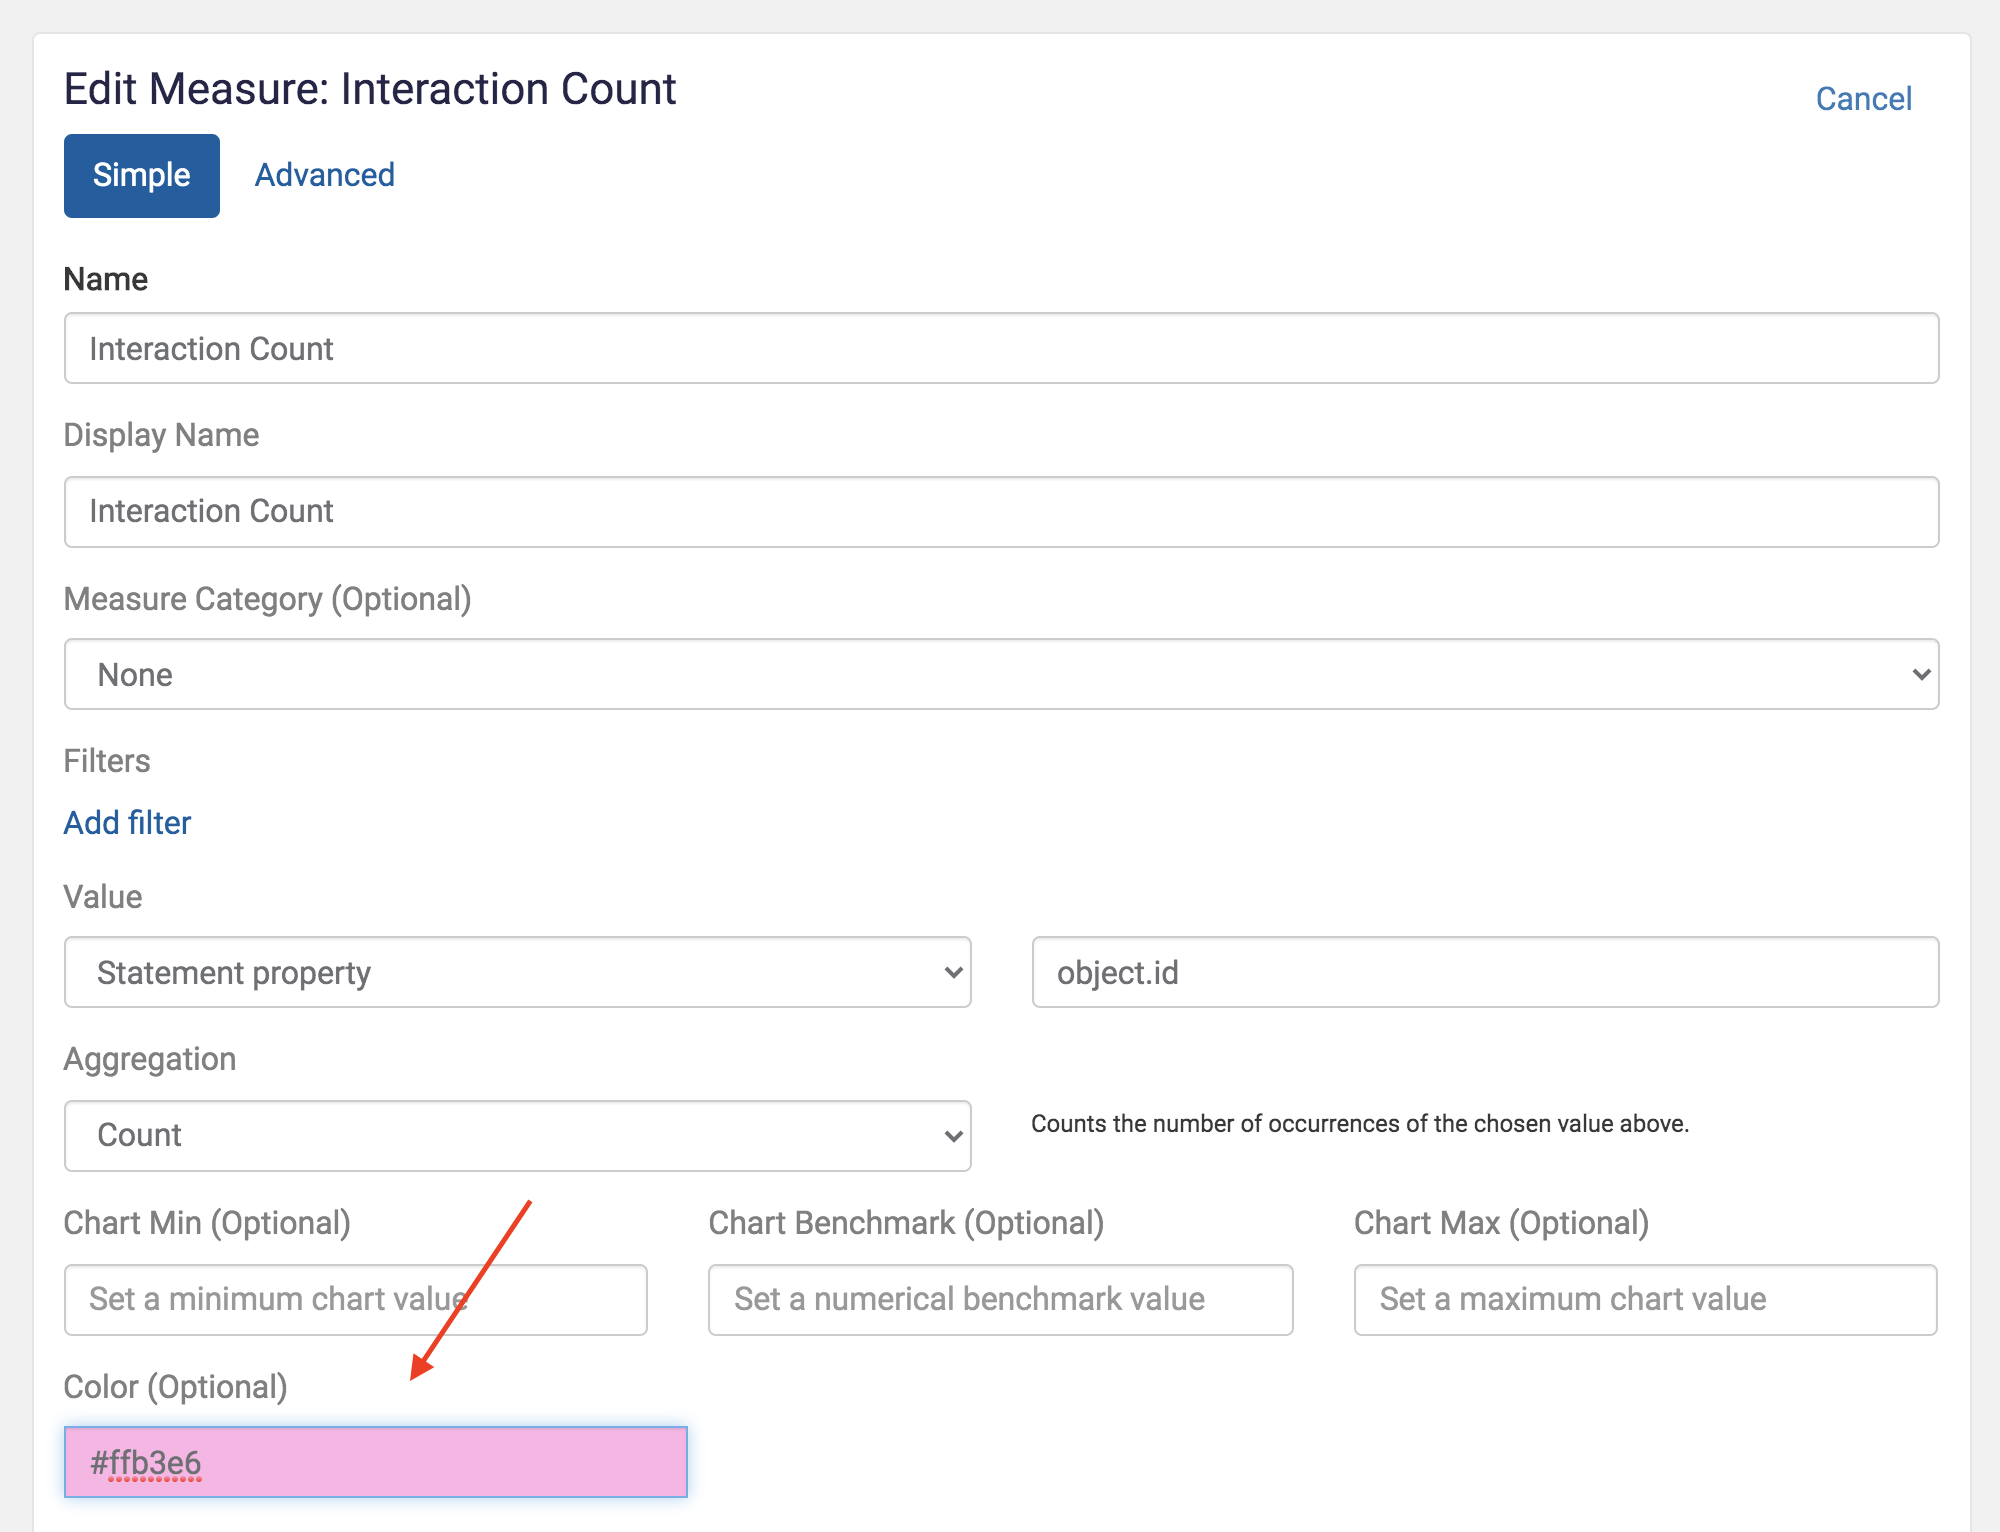
You can also assign colors to measures, so that the measure same color will be used for the measure in every report it appears on. This is done by editing the Color setting of the measure. The input box background will preview the color to be used for the measure.
Setting Report Colors
Customization at the report level is done using the colors Advanced Configuration property. This includes a list of valid CSS colors to be used in reports. For example the code below is used to set the chart colors to red, blue and green.
"colors": [
  "red",
  "#00ff00",
  "rgb(0,0,255)"
]
Please note: If colors are configured on a report that includes measures with configured colors, the report colors will be used rather than the measure colors.