What is a Spider Report?
The Spider report displays learner performance in a spider chart. Multiple performance measures (e.g., KPIs, competencies, or assessment scores) are plotted on the same scale. You can quickly compare how different individuals and groups are performing on the selected performance measures.
- User Types
- Any user with access to the report builder (Global Admins, Area Admins, and some Users) can edit a Spider report. All users can view a Spider report.
- Pricing
- Available on paid plans (Analyst, CLO, and Enterprise).
- Expertise
- Anybody (both beginners and experts) can use this feature.
Creating and Editing a Spider Report
Use the report builder to create new Spider reports and to configure existing Spider reports.
Spider Report Filters and Options
Beyond the typical report builder filters and options, the Spider report provides options that are unique to the Spider report.
Spider Filter
Select Spider from the report selection menu and then click Spider in the filter menu: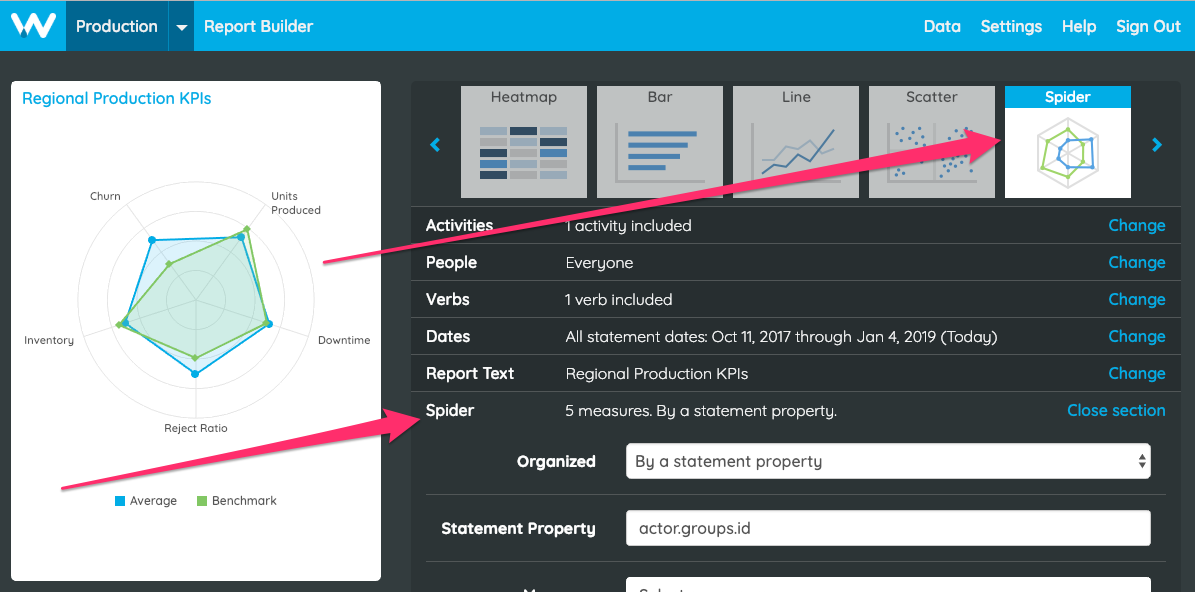
In the Spider filter, you’ll use the different menu items to customize your report.
Organized Menu
On the Organized menu, you’ll choose what you’d like to rank on the Spider report. Choose an option from the Organized menu and the shapes on the Spider report will be you’ve chosen. On the Leaderboard below the spider chart, each row will also be what you've chosen (each row represents a shape on the spider chart).
Measures Menu
On the Measures menu, you’ll choose how you’d like to rank what you chose in the Organized menu. You need to choose at least 3 measures for your Spider report.
Related: What are Measures?
To add a measure to the Spider report, choose a measure from the Select a Measure menu and click the Add Measure button next to the menu. The Report Builder will not preview the Spider report until you've selected 3 or more measures. To deselect a measure, click the X next to the Measure in the Measures section.
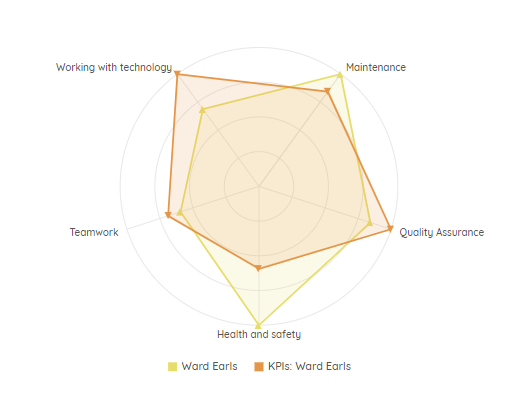
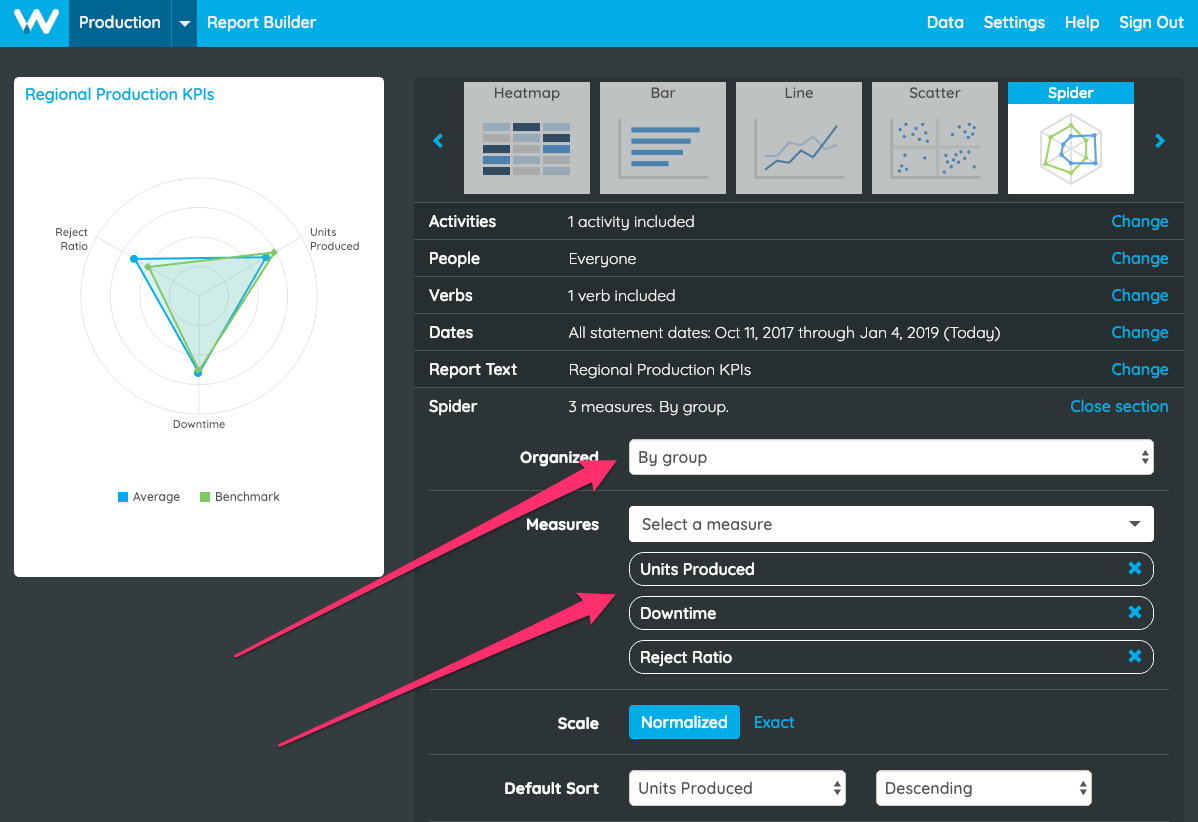 Each shape on the spider chart and row below the spider chart are groups. Each "spoke" on the spider chart are the chosen measures:
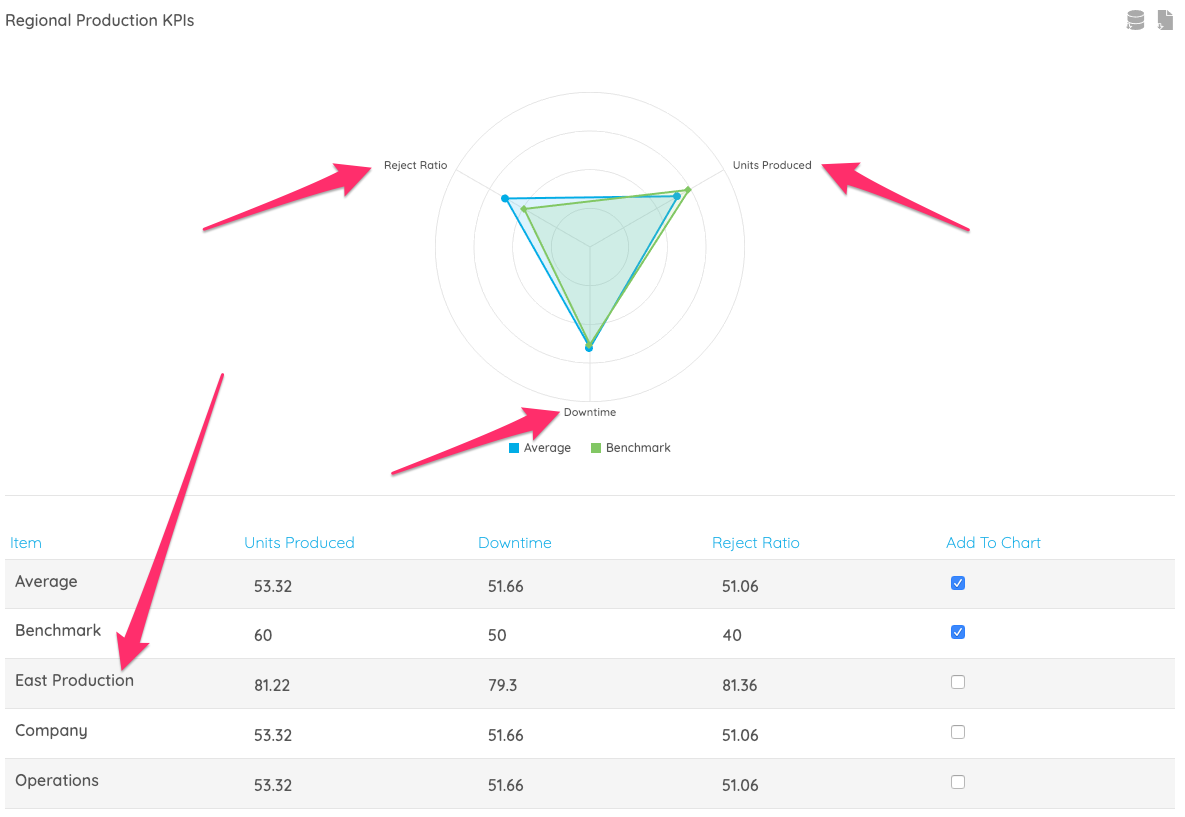
Scale Menu
The Scale menu allows you to choose the scale of how the measures are represented on the Spider report. You have two options:
- Normalized - When you choose Normalized, each individual measure is charted on a scale of the greatest value of that measure.
- Exact - When you choose Exact, each measure is scaled on a scale of the greatest value of amongst all of the measures.
Using Spider Reports
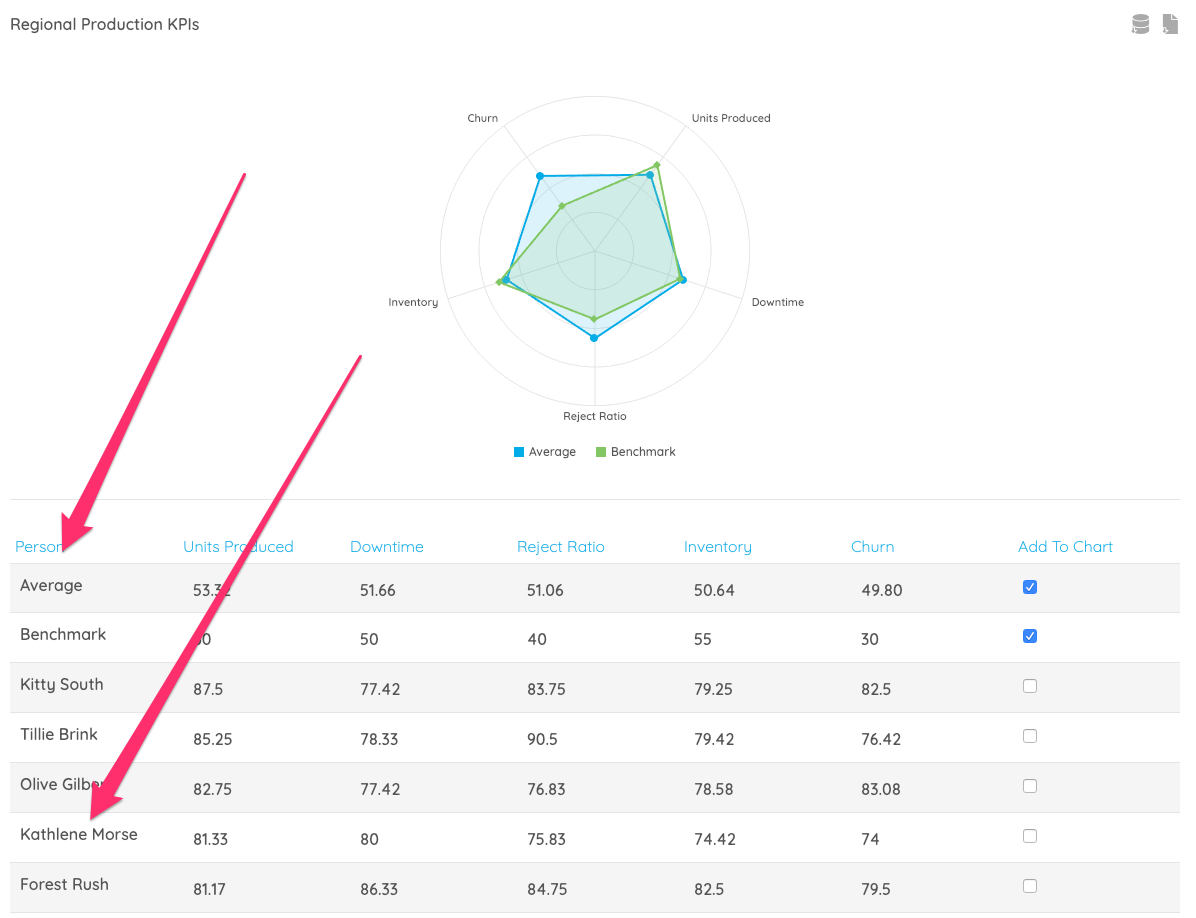
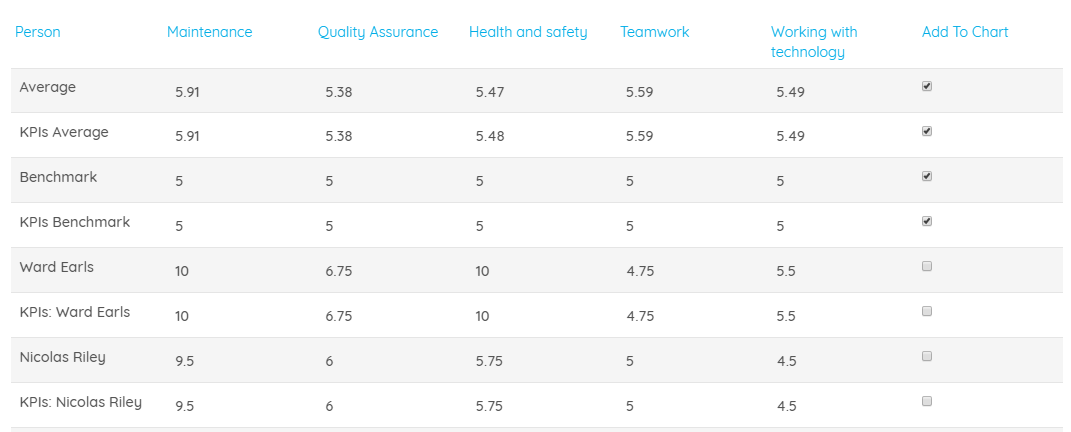
Each Spider report has a spider chart at the top and a leaderboard at the bottom. Choose which values are represented on the chart by selecting the Add to Chart column. The Average is an average of all values for each measure. The Benchmark is determined on a measure by measure basis in the Measure Editor.
Advanced Configuration
Advanced configuration is designed to be used by expert users who understand JSON and the properties of xAPI statements.
Related: Check out our Advanced Configuration guide for more information on customizing your reports.
Overlay
The Spider Report Advanced Configuration overlay property adds an additional row of data for each item in the report, using a different set of measures. This can be useful if you want to compare two sets of measures for an item, for example comparing knowledge quiz scores with related business outcome metrics.
The overlay property contains an object with two properties: name and measures. The name is used as the name of the overlay in the key and in table below the spider report. The example below shows an overlay with the name "KPIs".
The measures property contains an array of measures, just like the array of measures used for the main report. There must be the same number of measures in the overlay as the main report, and the measure order will determine how they are paired up.
Hint: You can copy measures from the main report to the overlay.
Related: Measure Advanced Configuration
An example report configuration using overlays is shown below. This has been simplified and redacted to reduce it's size.
{
  "filter": {
    ...
  },
  "dimensions": [
    {
      "type": "STATEMENT_PROPERTY",
      "statementProperty": "actors.person.id"
    }
  ],
  measures": [
    {
      "name": "Knowledge 1",
      "aggregation": {
        "type": "AVERAGE"
      },
      "valueProducer": {
        "type": "STATEMENT_PROPERTY",
        "statementProperty": "result.score.scaled"
      },
      "filter": {
        "activityIds": {
          "ids": [
            "http://example.com/knowledge-check/1"
          ]
        }
      }
    },
    {
      "name": "Knowledge 2",
      ...
    },
    {
      "name": "Knowledge 3",
      ...
    }
  ],
  "overlay": {
    "name": "Performance",
     "measures": [
      {
        "name": "Performance 1",
        "aggregation": {
          "type": "AVERAGE"
        },
        "valueProducer": {
          "type": "STATEMENT_PROPERTY",
          "statementProperty": "context.extensions[http://example.com/kpi/1]"
        }
      },
      {
        "name": "Performance 2",
        ...
      },
      {
        "name": "Performance 3",
        ...
      }
    ]
  }
}