What is a Range Report?
The Range report visualizes change between measure values. It’s perfect to view change of performance measures (e.g., KPIs, competencies, or assessment scores) before and after training, and it can also be used to visualize learners’ engagement with video.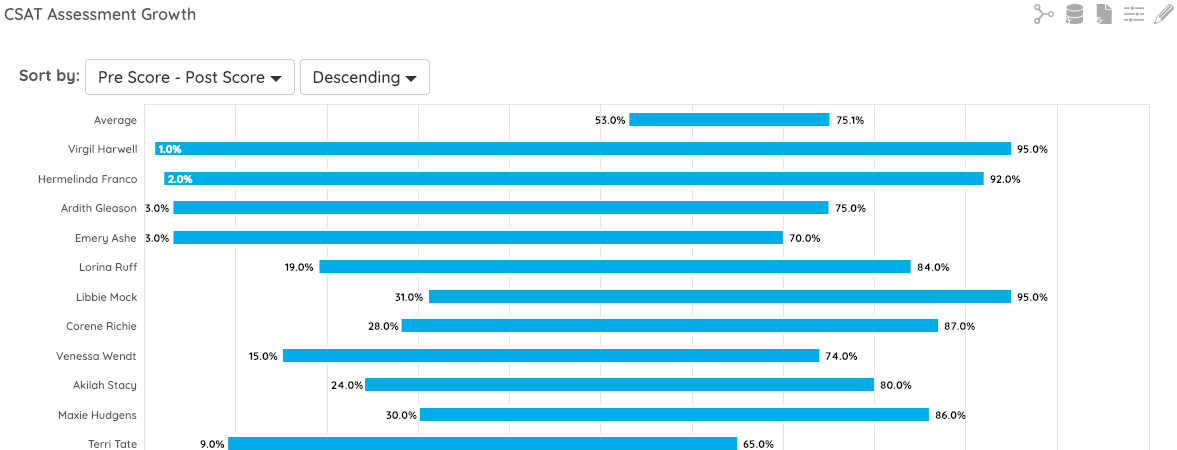
- User Types
- Any user with access to the report builder (Global Admins, Area Admins, and some Users) can edit a Range report. All users can view a Range report.
- Pricing
- Available on paid plans (Analyst, CLO, and Enterprise).
- Expertise
- Anybody (both beginners and experts) can use this feature.
Creating and Editing a Range Report
Use the report builder to create new Range reports and to configure existing Range reports.
Range Report Filters and Options
Beyond the typical report builder filters and options, the Range report provides options that are unique to the Range report.
Range Filter
When setting up a new Range report or configuring an existing Range report, click Range in the filter menu: 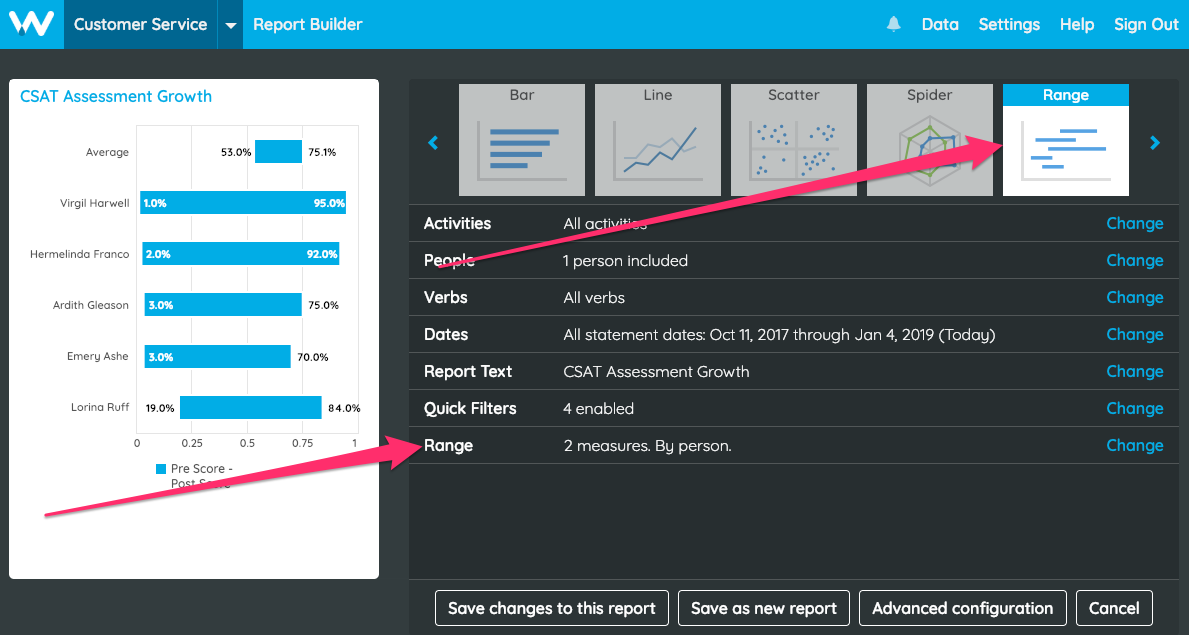
In the Range filter, you’ll use the different menu items to customize your report:
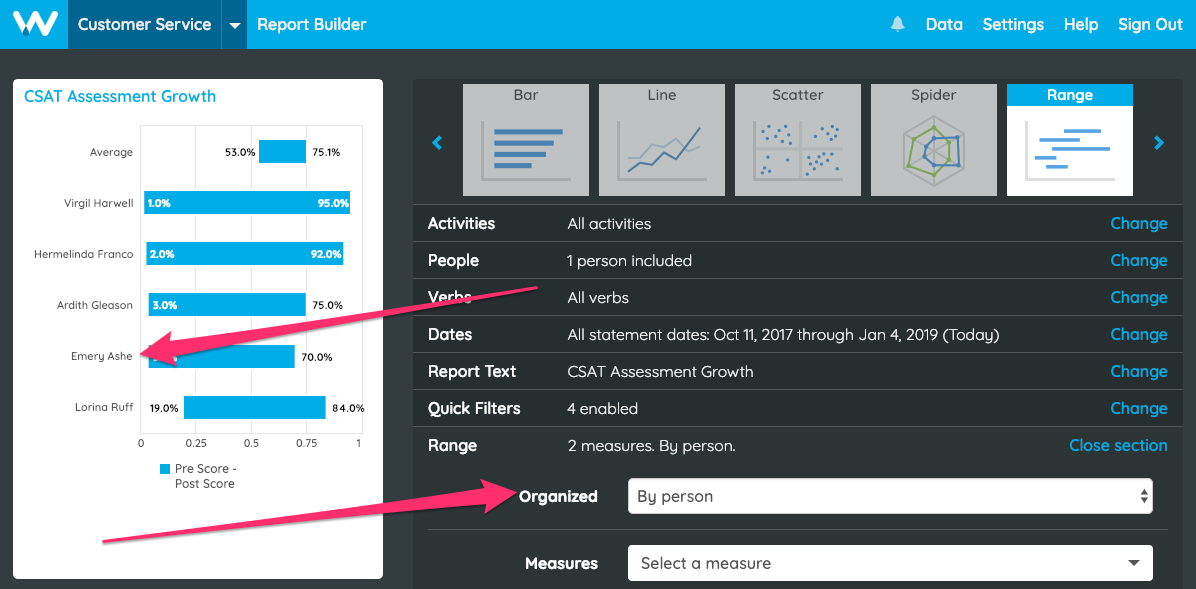
Organized
On the Organized menu, you’ll choose what you’d like to rank on the Range report. Choose an option from the Organized menu and the rows or columns on the Range report will be what you’ve chosen.
Measures
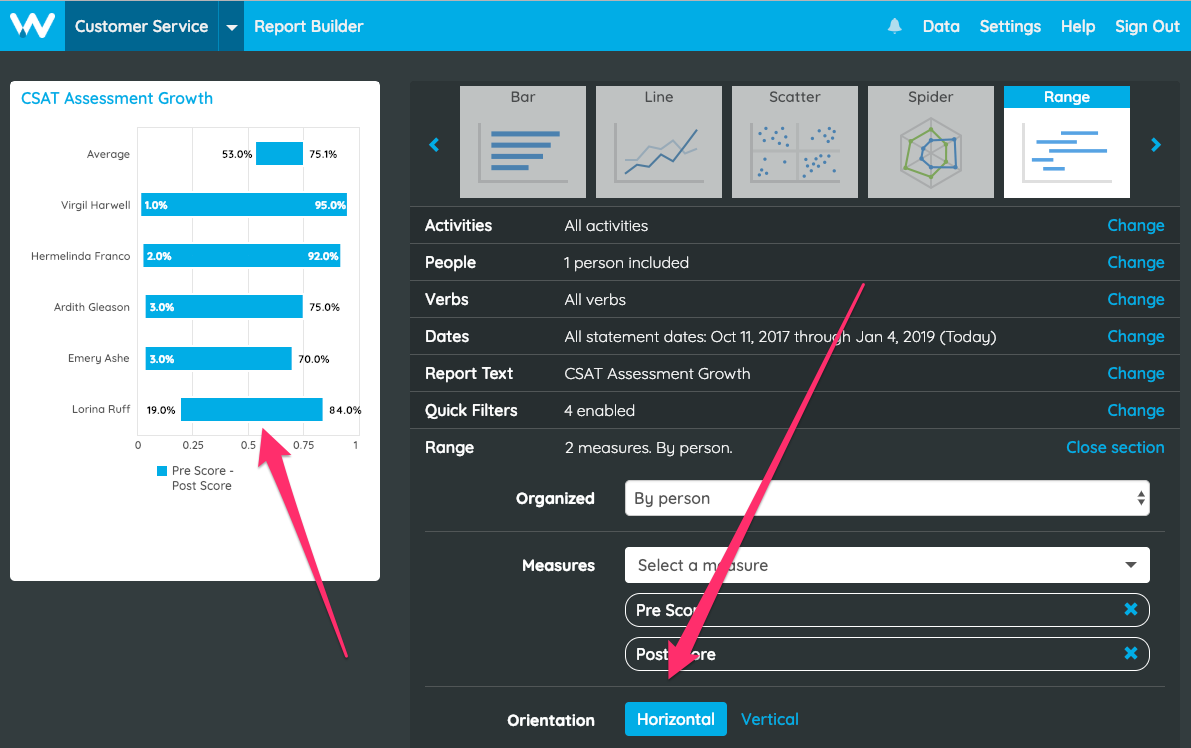
On the Measures menu, you’ll choose which measures you’d like to visualize on the Range report. You must choose two measures for the Range report—the first measure chosen will be the first number for each range displayed, and the second measure chosen will be the second. If the difference between the two measure values is negative, the Range report will display a red bar instead of the default color.
Related: What are Measures?
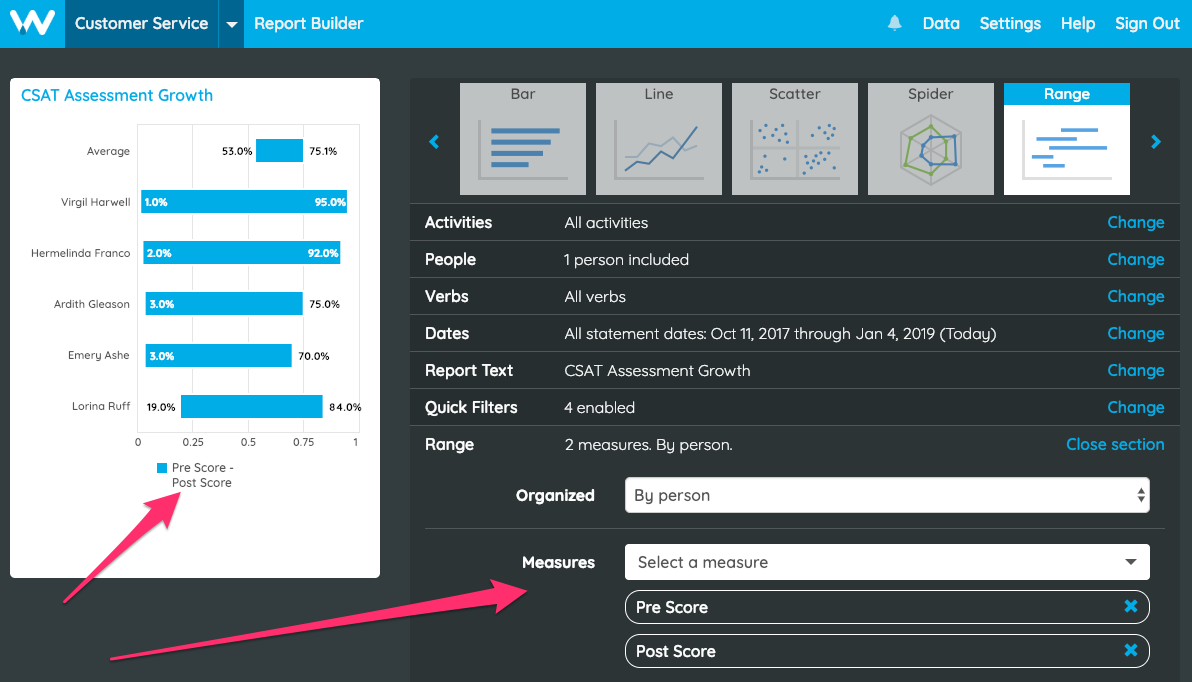
To choose measures for the Range reports, choose two from the Select a Measure menu and click the Add Measure button next to the menu. The first measure chosen will represent the "starting" measure and the second will represent the "ending" measure. To deselect a measure, click the X next to the Measure in the Measures section.
Orientation
The Orientation menu controls whether the Range report displays horizontal or vertical bars.
 Here are is an example of vertical orientation:
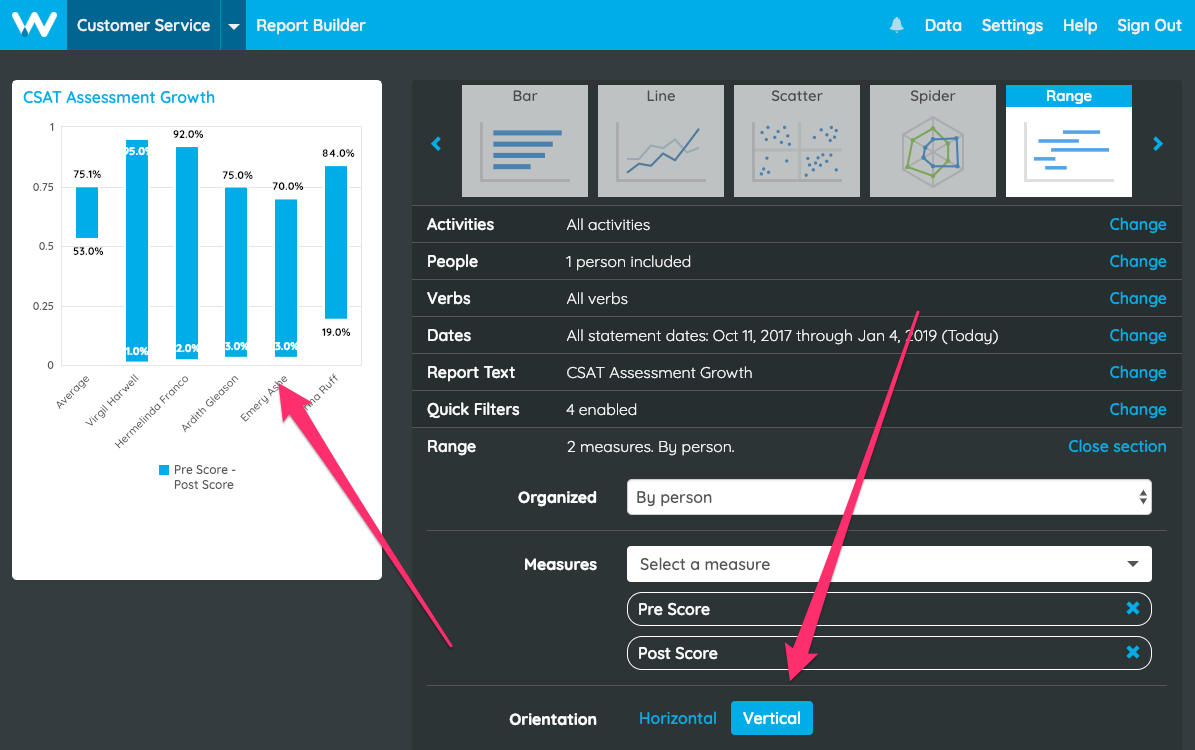
Default Sort
With Default Sort, choose how you want your report to be sorted when users first load it. Report viewers can still sort as they need when viewing the report.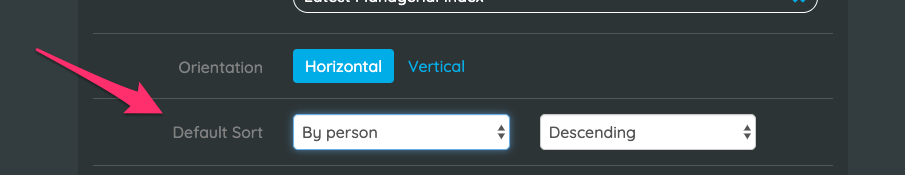
Average Bar
The Average Bar shows the change between the average values of each measure: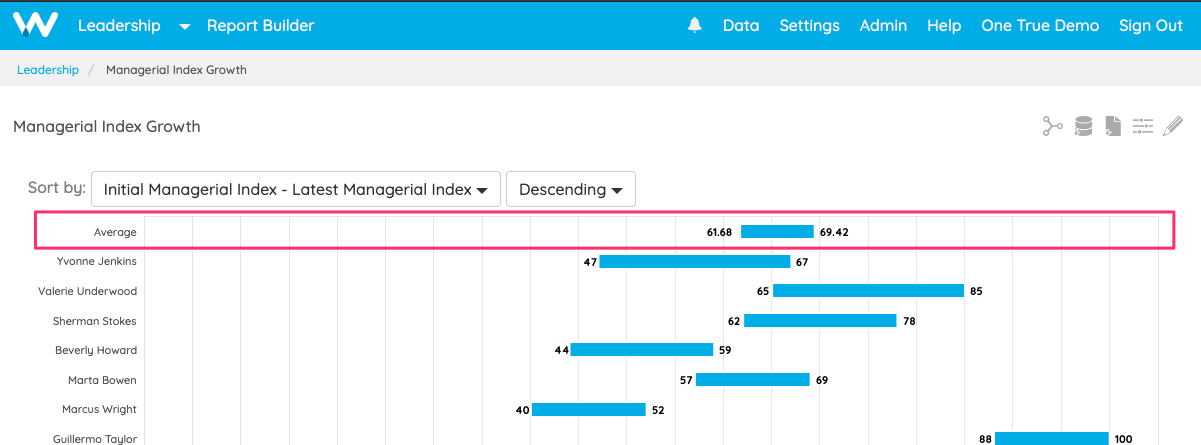
With the Average Bar option, choose if you want to show the Average Bar on your Range Report. Choose the Include option to show the Average Bar. Choose Don't Include to remove the Average Bar:
 An example with the Average Bar not included:
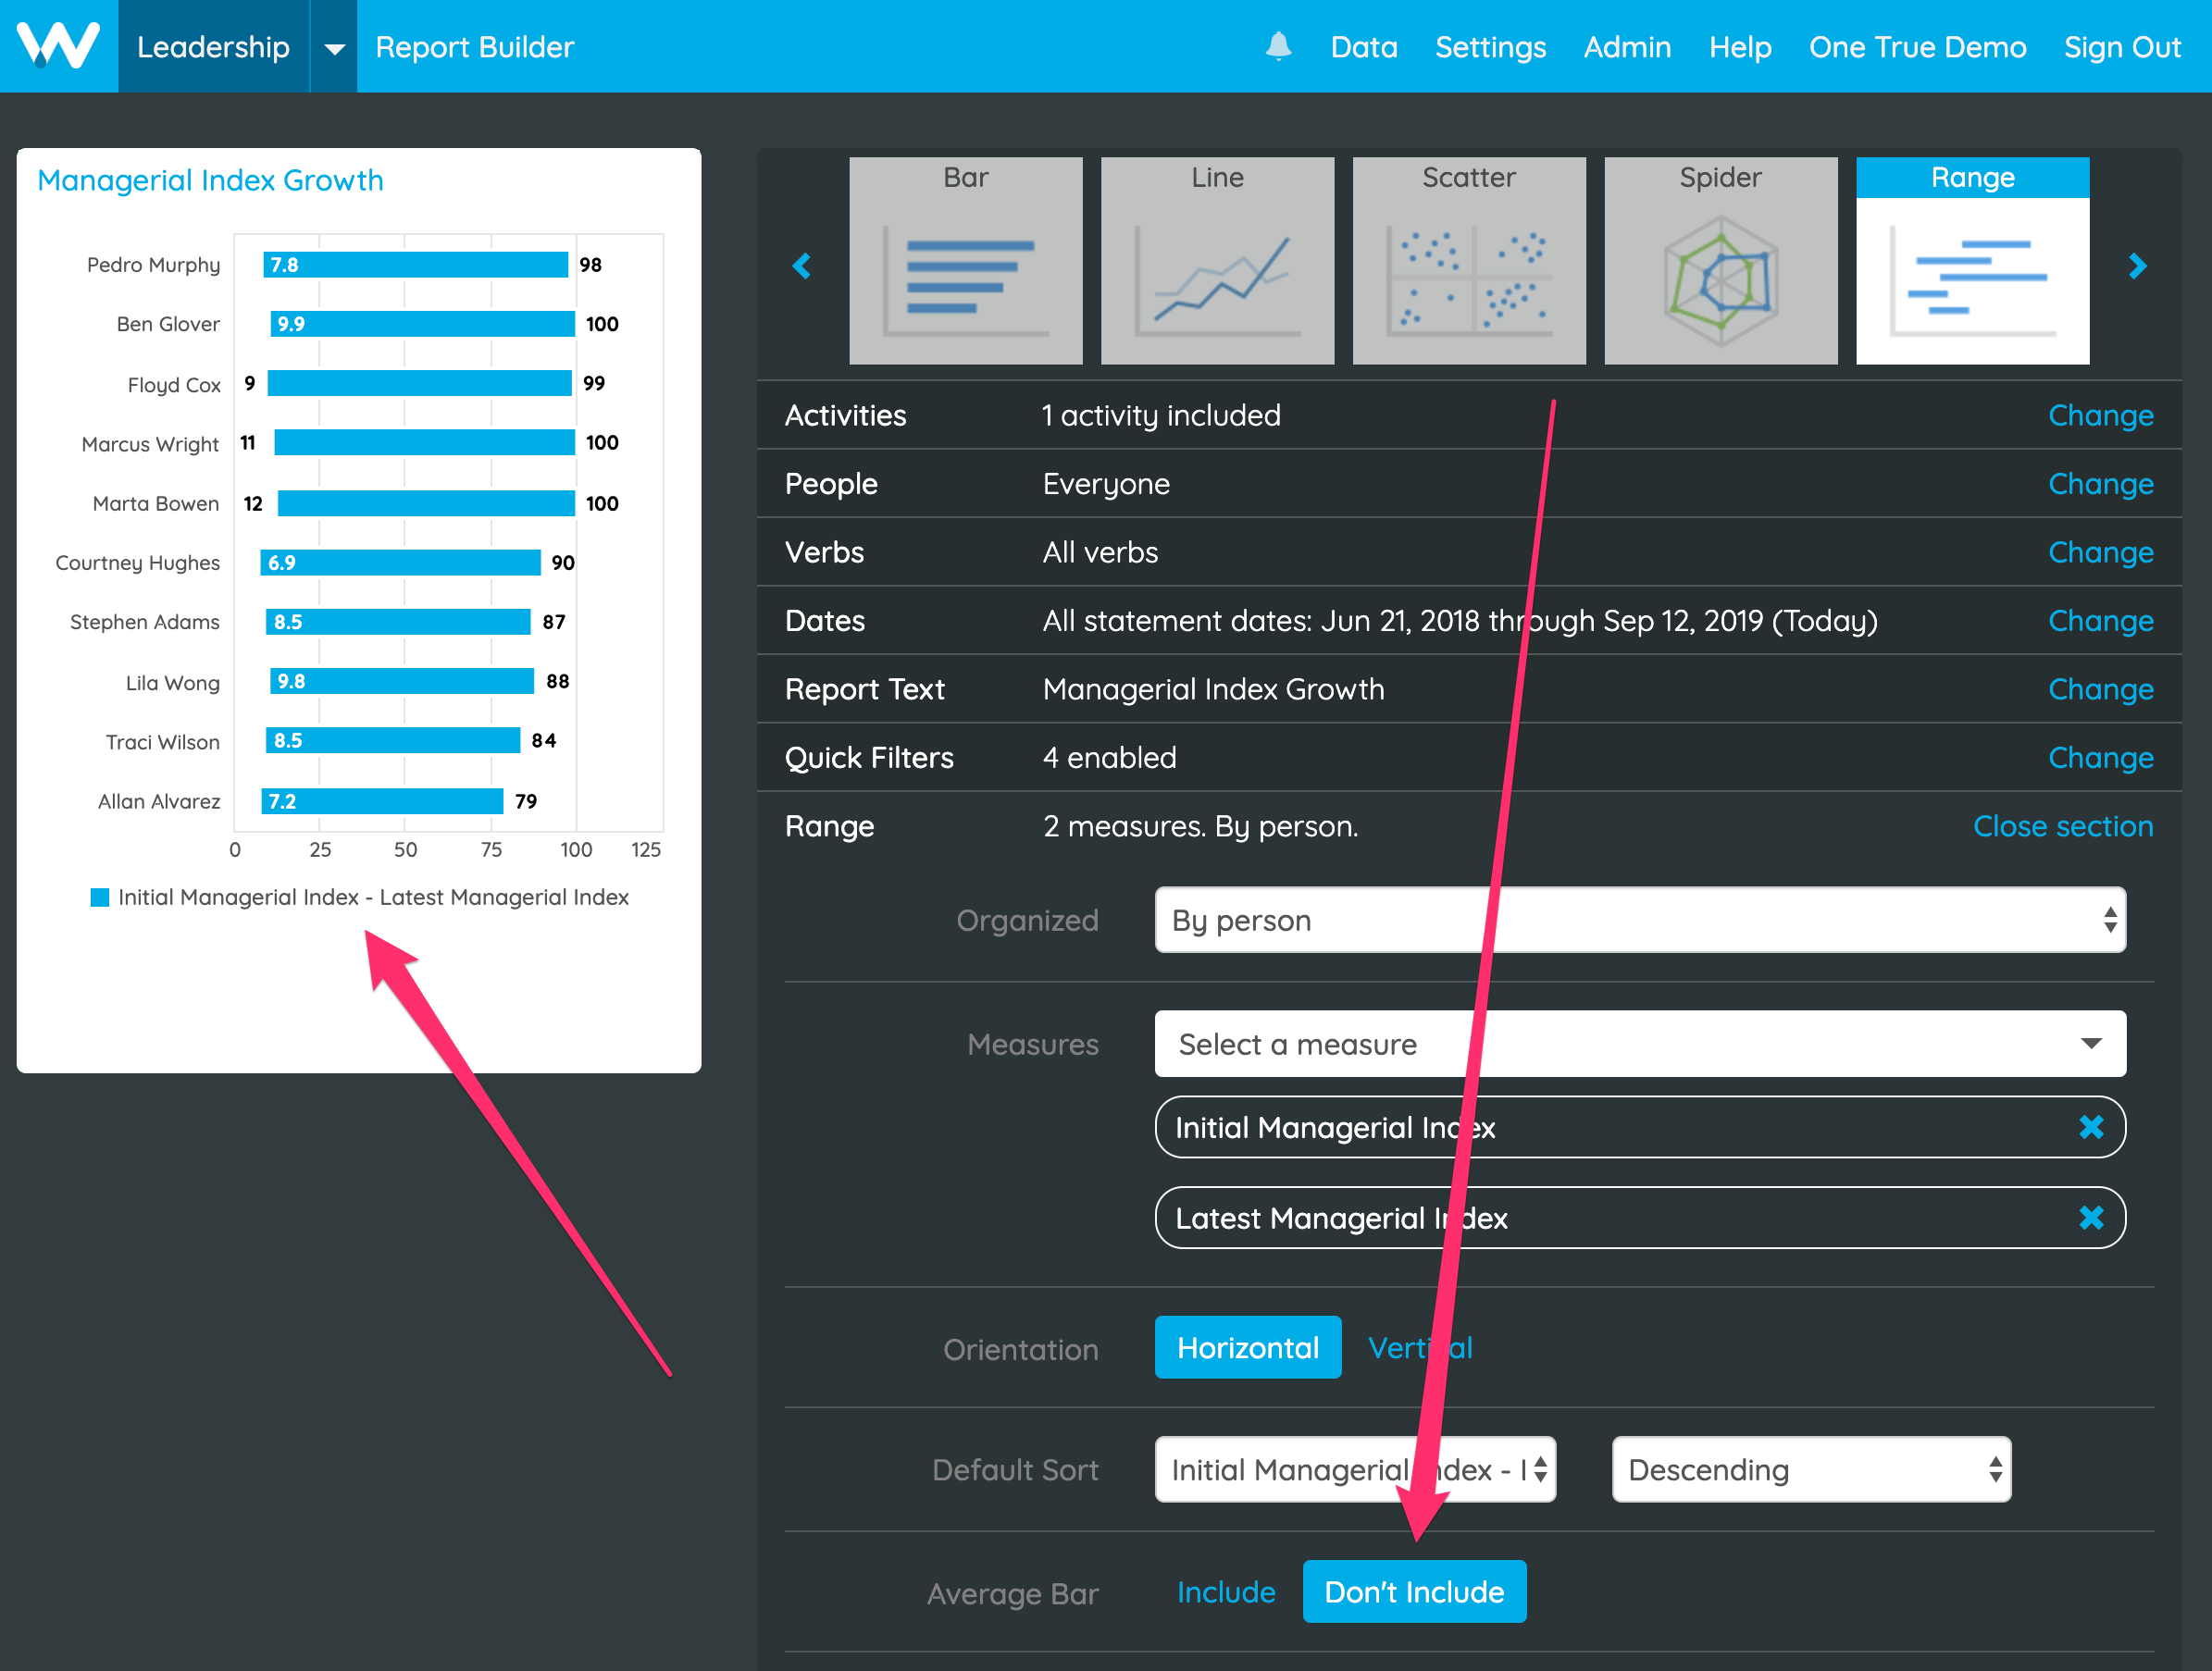
Advanced Configuration
Advanced configuration is designed to be used by expert users who understand JSON and the properties of xAPI statements.
Related: Check out our Advanced Configuration guide for more information on customizing your reports.