Every report in Watershed can be shared with a live link or embedded into another system (like Salesforce or an LMS). Sometimes though, you'll need to take the data from a report and transform it or share it via a spreadsheet. When this happens, you're able to download the data that makes up reports as CSVs.
- User Types
- Any user that can access a report (Global Admins, Area Admins, and Users) can use this feature.
- Pricing
- Available on paid plans (Analyst, CLO, and Enterprise).
- Expertise
- Anybody (both beginners and experts) can use this feature.
Different Types of Downloads
You can download reports in one of two ways:
- Download Data Tables: This option downloads aggregated data as it's presented in reports.
- Download Interaction Statements: This option downloads the raw xAPI statements that make up the report.
In both cases, a CSV is downloaded. Any user with access to a report can download that report's CSVs.
Download Data Tables
At the top right corner of the full view of reports you'll see the option to Download Data Tables: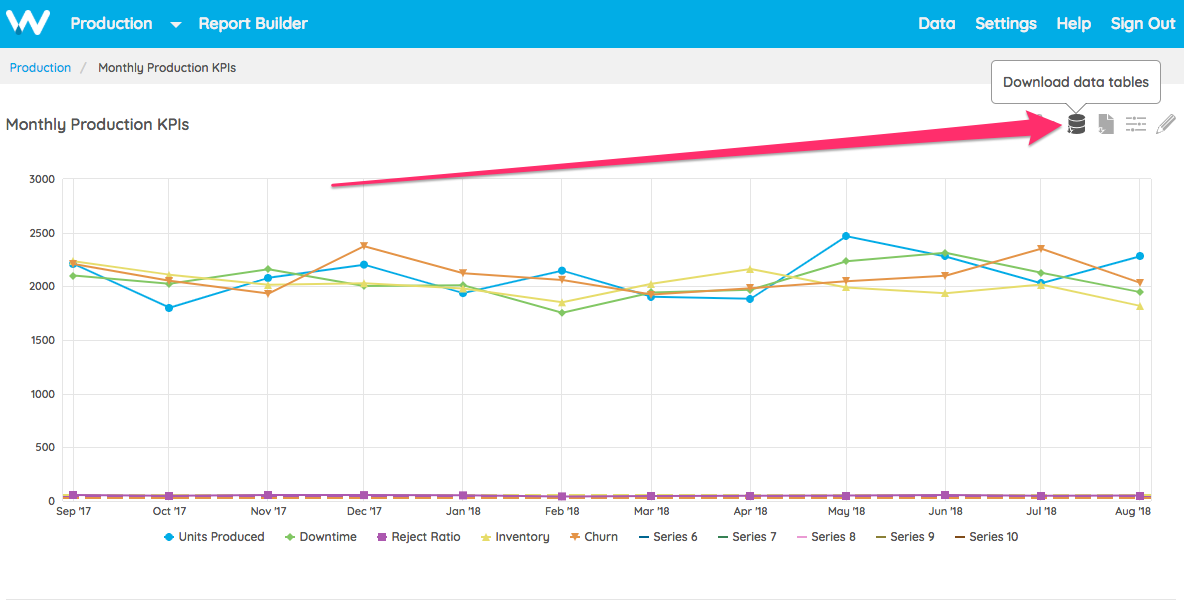 Clicking Download Data Tables downloads the aggregated data as it's shown in the report or the aggregated data that's used to create the visualizations in the report. For instance, clicking Download Data Tables for a Leaderboard report downloads the data as it's shown in the report. Clicking Download Data Tables for a Bar report downloads the aggregated data that's used to create the bar visualization in the report. Clicking Download Data Tables in Activity reports downloads data from every visualization in the report.
Program Reports
As Program reports contain multiple tables of data, when downloading data tables from one a .zip file will be downloaded. This file contains two .csv files, one with a filename ending in groups and the other with it ending with people.
The Groups File
The groups file contains information about the leaners progress through the learning program aggregated by the groups the report is filtered too:
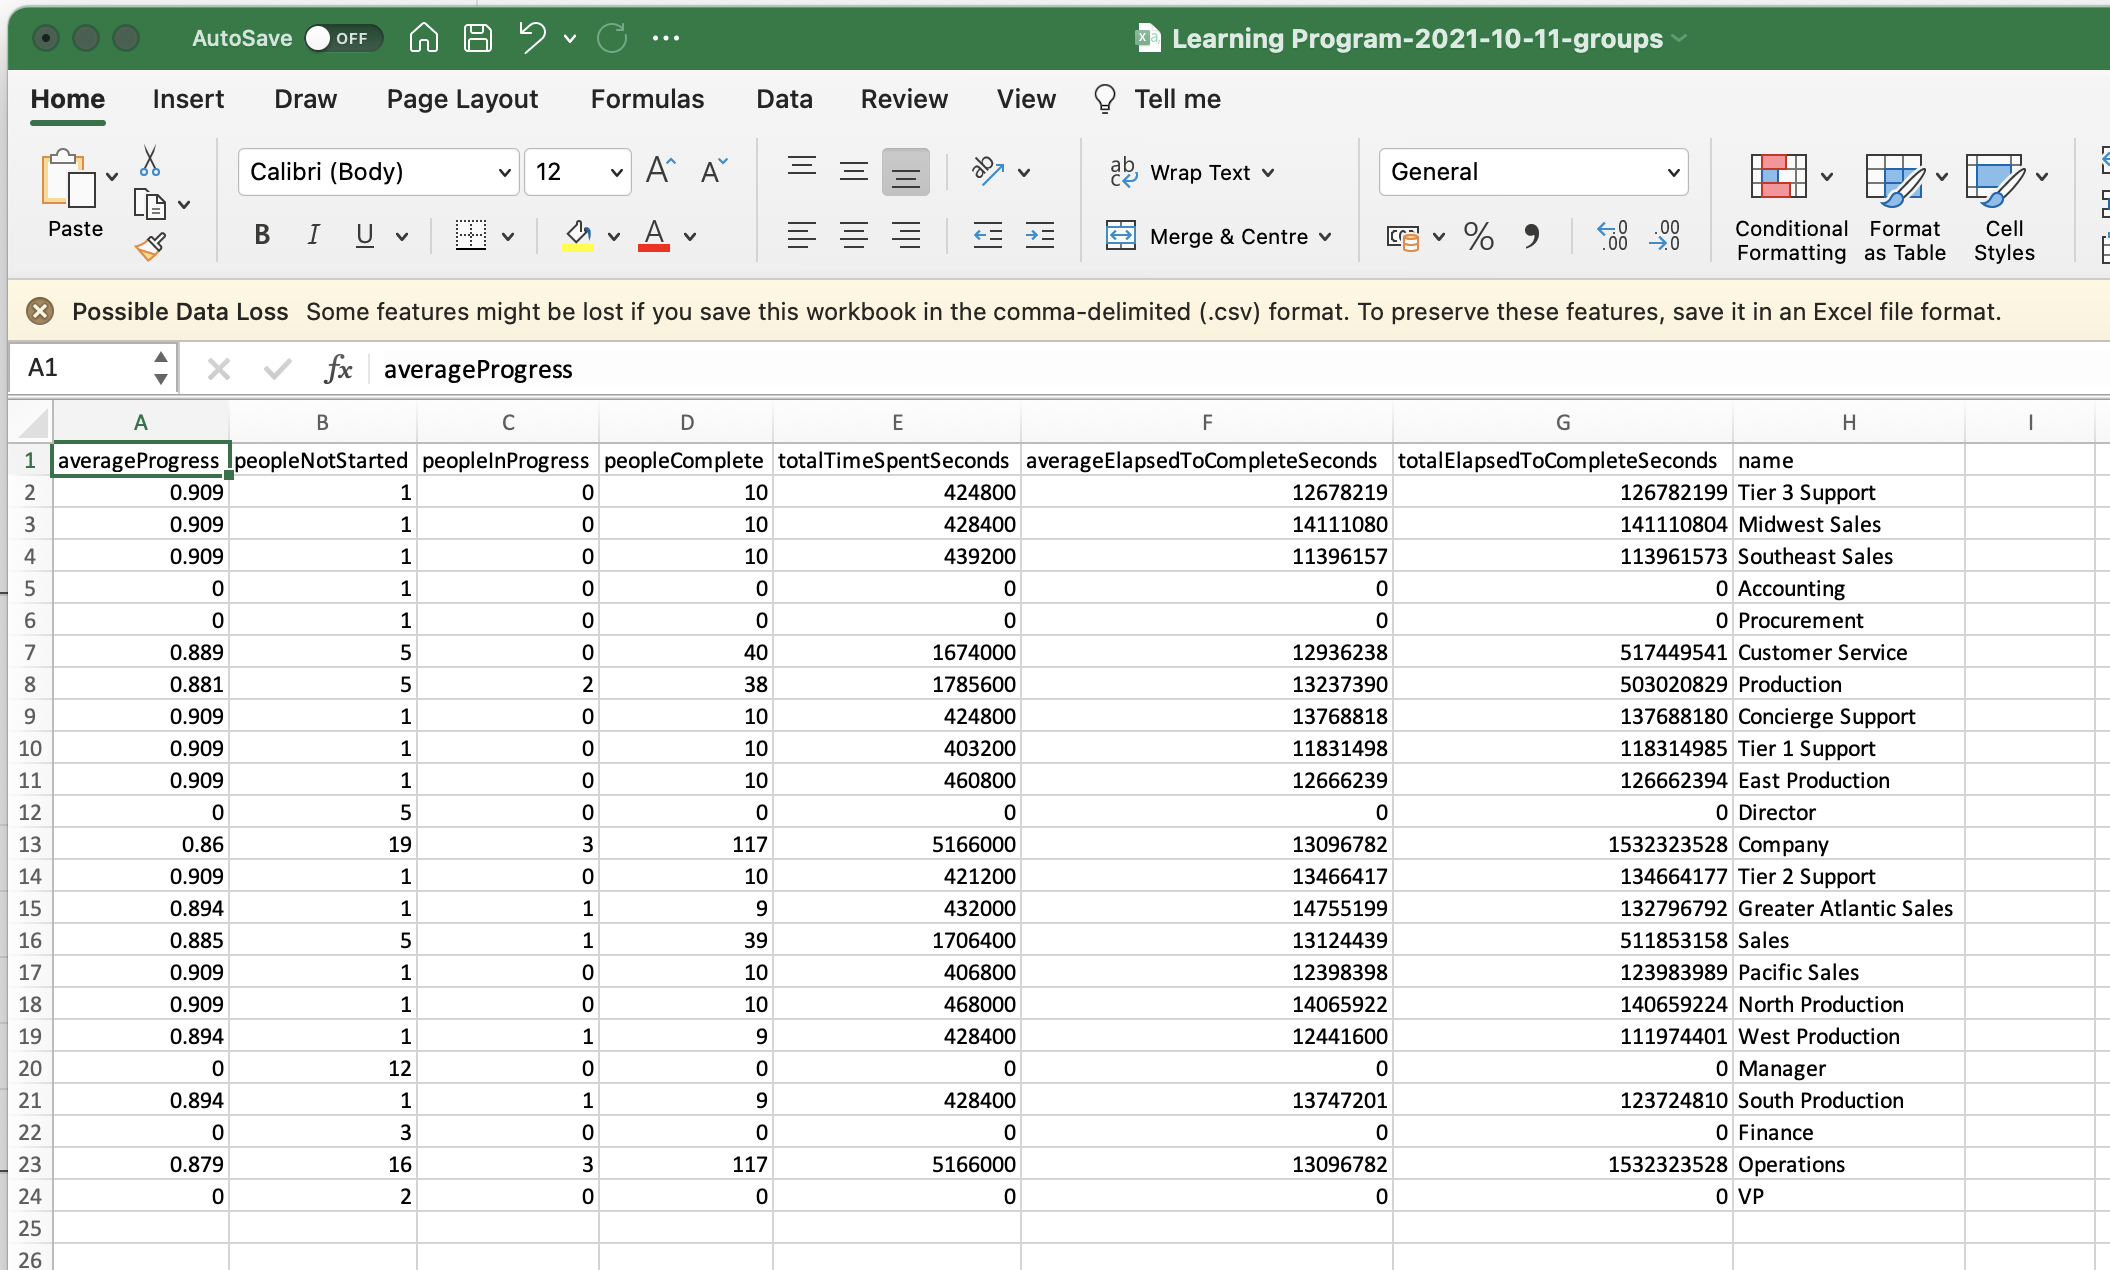
Column descriptions:
- averageProgress. This is the average progress through the learning program for all members of the group. The data in this column is a decimal percentage, for example 0.754 would be 75.4%.
- peopleNotStarted. A count of the group members who have not started the learning program.
- peopleInProgress. A count of the group members who have started but not completed the learning program.
- peopleComplete. A count of the group members who have completed the learning program.
- totalTimeSpentSeconds. The total time members of the group have spent in the learning program in seconds.
- averageElapsedToCompleteSeconds. This column is the average time people who have completed the learning program spent.
- totalElapsedToCompleteSeconds. This is the total time group members who have completed the learning program have spent.
- name, the name of the group
The People File
The people file contains data about all of the individuals who are in the program report.
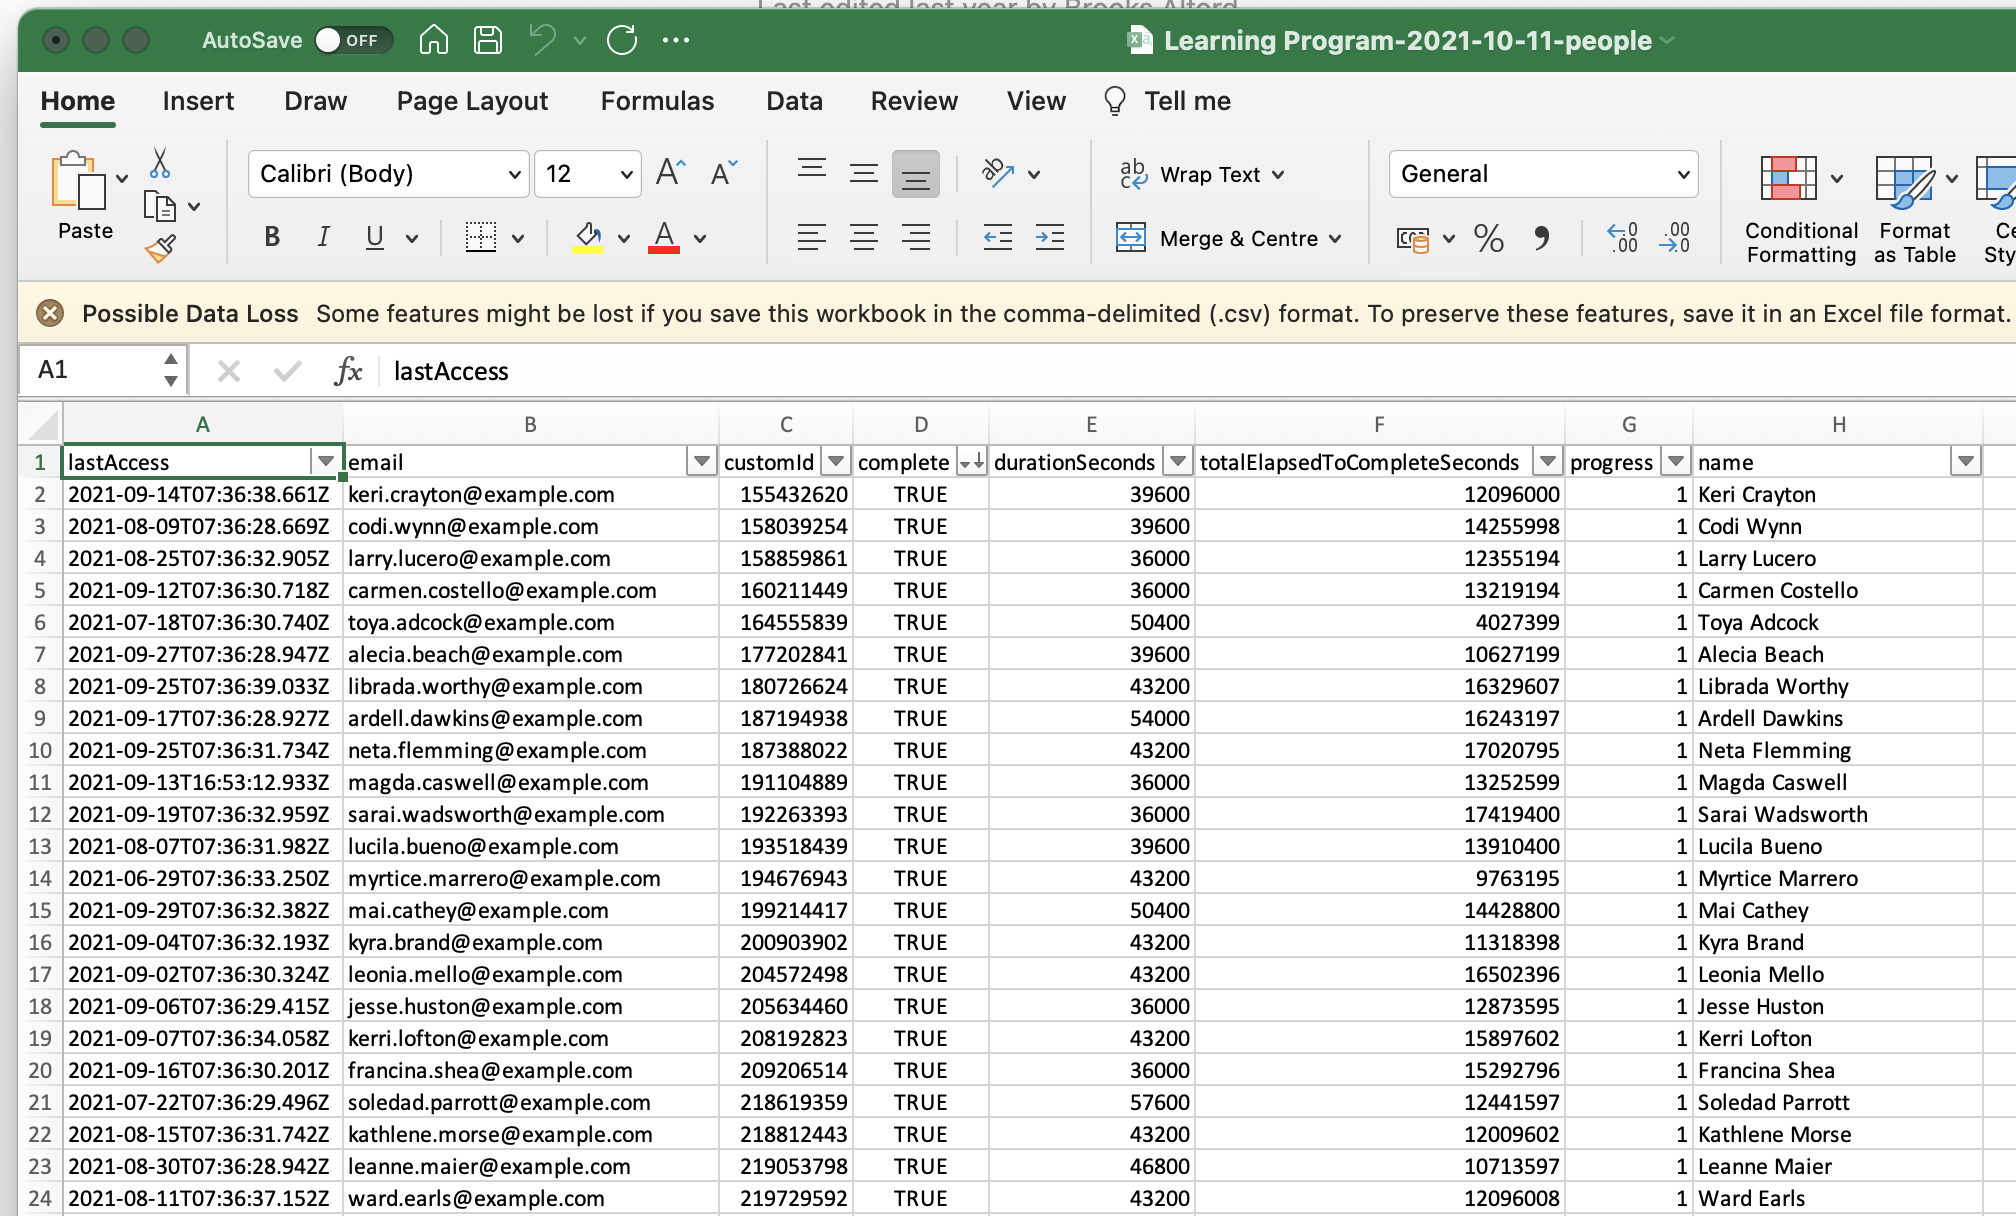
Column descriptions:
- lastAccess. This is the last time the learner access any part of the learning program.
- email. The email address of the learner.
- customId. The custom identifier of the learner.
- complete. If true the learner has completed the program.
- durationSeconds. The total duration the learner spent in the program.
- totalElapsedToCompleteSeconds. This is the total elapsed time the learner spent to complete the program.
- progress. This is the progress of the learner through the learning program in a decimal percentage. For example 0.754 would be 75.4%.
- name. The name of the learner
Download Interaction Statements
At the top right corner of the full view of reports you'll see the option to Download Interaction Statements: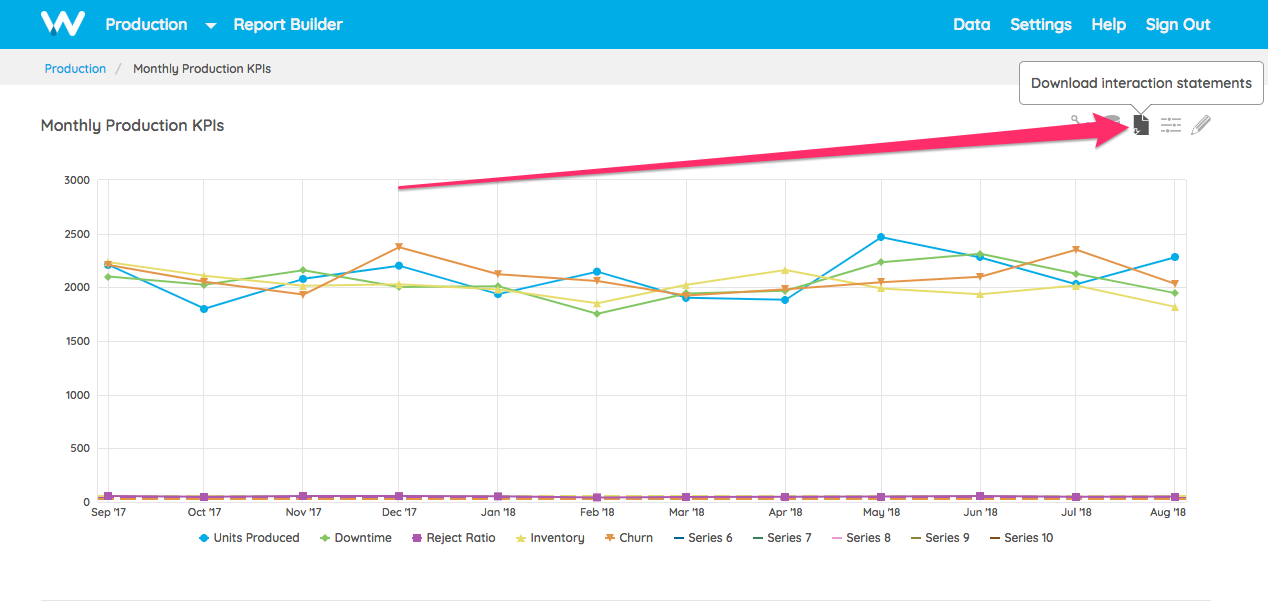
Clicking this link will download a CSV of every xAPI interaction statement associated with this report. This is useful to troubleshoot issues or to see the set of data that Watershed used to create the report you're seeing.