Several reports (such as Leaderboard and Correlation) aggregate data using dimensions and measures. In Simple Configuration, dimensions are represented by the Organized field. Data can be organized by person, group, day, week, month, year, activity or activity type. If the dimension you need is not on that list, you can use advanced configuration to create a custom dimension. For example perhaps you want to organize data by a context property such as a context activity or instructor.
Advanced Statement Property Dimensions
Statement property dimensions break data into items based on the value of a specified statement property. There are some advanced options that can be used to access things like JSON arrays:
|
Property |
Explanation |
Example |
|
type |
The type of dimension |
STATEMENT_PROPERTY |
|
statementProperty |
The property of the xAPI statement to organize data by. |
actor.person.id |
|
caseSensitive |
Defaults to true. If false, items that are the same in all but case will be grouped together. This is especially useful when organizing by the result.response statement property. |
false |
|
valueType |
The data type of the statement property. Use this when the statement property is an extension |
number |
|
missing |
The value to be used for statements that are missing a specific property. Use this when some of your data is missing values. |
"N/A" or 1234 or false |
Valid value types are string, number, boolean, time, duration, percentage and array.
Here’s a complete example that organizes by parent context activity:
"dimensions": [
  {
    "type": "STATEMENT_PROPERTY",
    "statementProperty": "context.contextActivities.parent.id"
  }
]
Here’s another example that organizes by a context extension:
"dimensions": [
  {
    "type": "STATEMENT_PROPERTY",
    "statementProperty": "context.extensions.[http://example.com/xapi/extensions/context/example]"
  }
]
Here’s an example that organizes by response case insensitively:
"dimensions": [
  {
    "type": "STATEMENT_PROPERTY",
    "statementProperty": "result.response",
    "caseSensitive": false
  }
]
Where you need to organize by the value of an extension held in an array, you need to use the __arr__*__ syntax where * changes depending on the values expected within the array:
__arr__str__- String values__arr__num__- Number values__arr__bool__- Boolean values__arr__arr__- Array values (array within an array)__arr__obj__- Object values__arr__null__- Null values
For example, the following will organize by values of the 'label' property of objects held in an array within the 'value' property of an extension.
{
  "type": "STATEMENT_PROPERTY",
  "statementProperty": "object.definition.extensions.[http://example.com/extension/example].value.__arr__obj__.label"
}
Please note: We're using __arr__obj__ because we're looking for a label property within an array called value that contains objects.
Here's an example that will organize all statements missing a result.success as if it were false:
"dimensions": [
  {
    "type": "STATEMENT_PROPERTY",
    "statementProperty": "result.success",
    "missing": false
  }
]
Organize by data source
A statement property dimension can be used to organize a report by data source. In this case the statement property used is authority.account.name property.
{
  "type": "STATEMENT_PROPERTY",
  "statementProperty": "authority.account.name"
}
Custom Dimensions
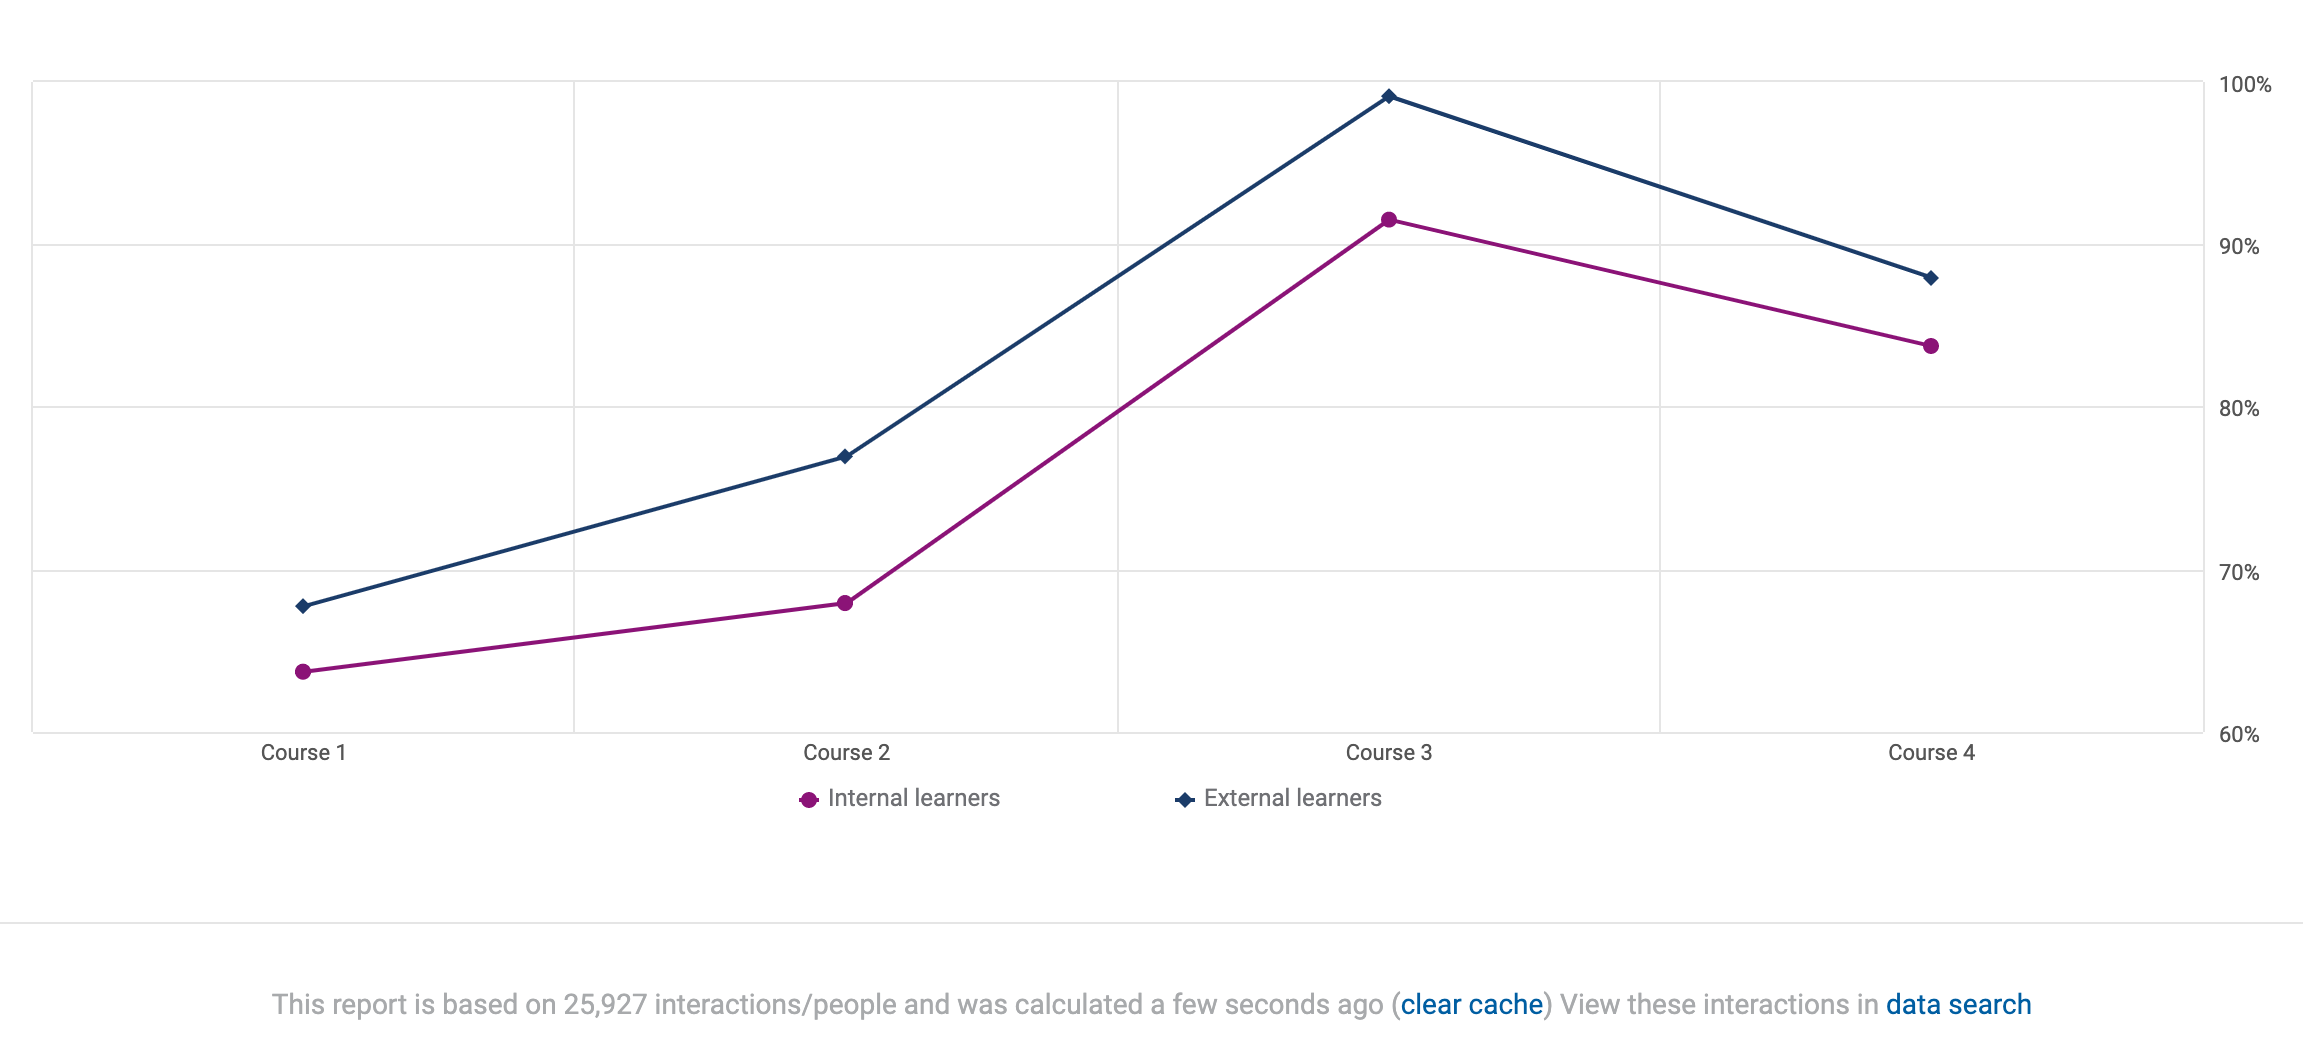
The simple configuration of Line and Bar charts only allows for Time based dimensions, but using an advanced configuration you can utilise any part of an xAPI statement as a dimension. To configure these, you can use any statement property dimensions. For example, when using a object.id as the dimension, the report will list all of the objects across the X axis of the report, with a line per measure:
Histogram Dimensions
When working with numerical values, it can often be useful to group those values into buckets. For example, perhaps you want to report on how many times people pause a video at different points in the video. It would be unhelpful to compare every possible video duration value down to the millisecond, but by grouping duration values into buckets of 1, 5 or 10 seconds, you can get a much clearer picture. The Histogram Dimension enables you to do exactly that.
|
Property |
Explanation |
Example |
|
type |
The type of dimension. |
HISTOGRAM |
|
statementProperty |
The property of the xAPI statement to organize data by. |
context.extensions.[http://id.tincanapi.com/extension/ending-point] |
|
valueType |
The data type of the statement property. Use this when the statement property is an extension |
duration |
| interval | The size of each bucket in whatever units the statement property is measured in. For example, durations are measured in centiseconds (100ths of a second). | 1000 |
| minCount | The minimum number of statements required for a bucket to appear on the report. This defaults to 1 and cannot be 0 (or negative). Use this if you only want to show buckets that have a minimum amount of data. | 1 |
| minValue | The starting point for the first item to display. Statements with a statementProperty value lower than this minimum will be ignored. | null |
| maxValue | The top value for the last item to display. Statements with a statementProperty value higher than this maximum will be ignored. | null |
The example below shows how to use a histogram dimension to look at a video in 10 second intervals between 30 and 60 seconds.
"dimensions": [{
  "type": "HISTOGRAM",
  "statementProperty": "result.durationCentiseconds",
  "interval": 1000,
  "minCount": 1,
  "minValue": 3000,
  "maxValue": 6000
}]
Time Period Dimensions
Time period dimensions group statements together by time period.
|
Property |
Explanation |
Example |
|
type |
The type of dimension. |
TIME |
|
timePeriod |
Used with the TIME type to specify the time period. |
YEAR |
|
format |
Used with the CUSTOM timePeriod format to specify a custom time period. Here's a list of allowed format values. |
ha 'on' E |
Here’s an example that organizes by hour of the day. Labels display values like "1PM":
"dimensions": [
  {
    "type": "TIME",
    "timePeriod": "CUSTOM",
    "format": "ha"
  }
]
Here’s an example that organizes by day of the week. Labels display values like "Tuesday":
"dimensions": [
  {
    "type": "TIME",
    "timePeriod": "CUSTOM",
    "format": "E"
  }
]
Here’s an example that organizes by hour of the day and day of the week combined. Labels display values like "Mon 13:00":
"dimensions": [
  {
    "type": "TIME",
    "timePeriod": "CUSTOM",
    "format": "E HH:00"
  }
]
Default sort
defaultSort is a property of the report configuration object (not the dimension) that determines how dimension items are sorted.
- Use
dimension[0].labelto sort by the dimension. - Use
measure[n].valueto sort by the measure with index n. - Use the prefix "-" to sort descending instead of ascending.
For example, to sort by the 5th measure (index 4) from highest to lowerest value use:
"defaultSort": "-measure[4].value"