In our Client Spotlight: Caterpillar's 'Kaltura Anomaly Detection' Dashboard, we showcased how Caterpillar are using Watershed to identify the handful of videos that are being watched by significantly more people, significantly more times than other videos. It's an exciting use case, and other clients have asked how they can do the same thing. This help guide explains how!
- User Roles
- Global Admins, Area Admins, and some Users can use this feature.
- Pricing
- Available on paid plans (Enterprise).
- Expertise
- Both beginners and experts can use this feature.
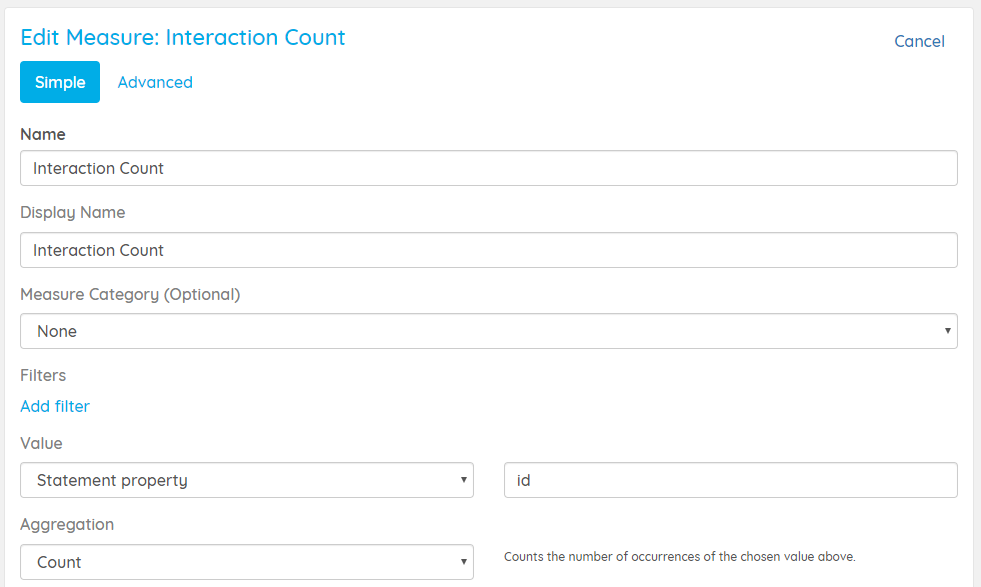
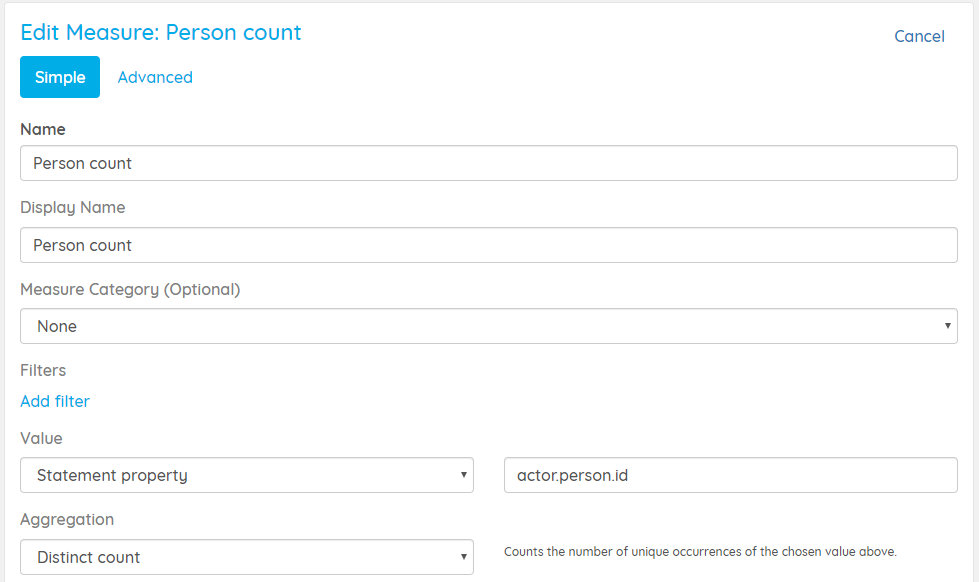
1. Create the measures
The first step is to create the measures that will be used in the reports: Interaction Count and Person count. These measures may already exist in your account. If not, an admin will need to create them using the Measure Editor. The configuration settings are shown in the screenshots below:
2. Create dashboard
You'll be creating several reports - one for each month - so you'll need to create a new dashboard. This help guide explains how to create new dashboards: Creating and Editing Dashboards.
3. Create the reports
With the measures and dashboard in place, you can now use Report Builder to create the report.
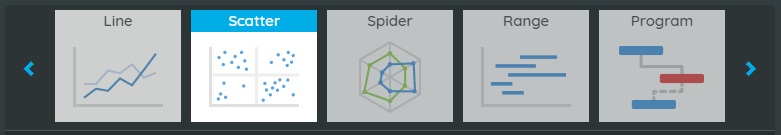
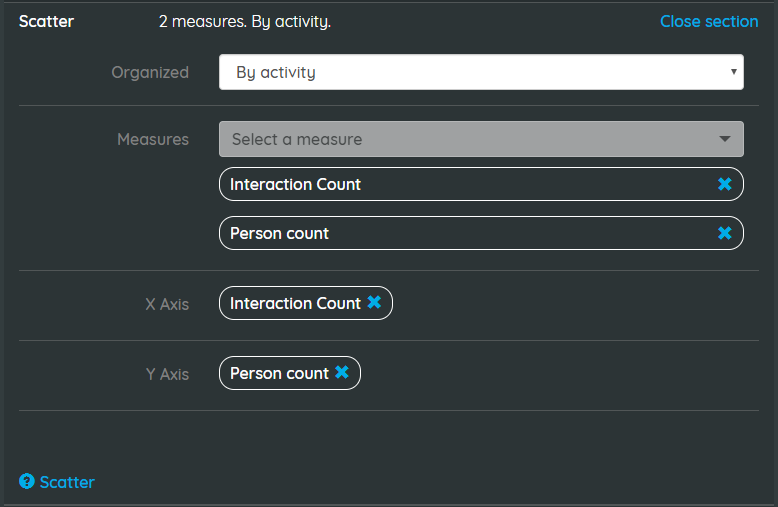
1. Select the Scatter report type.
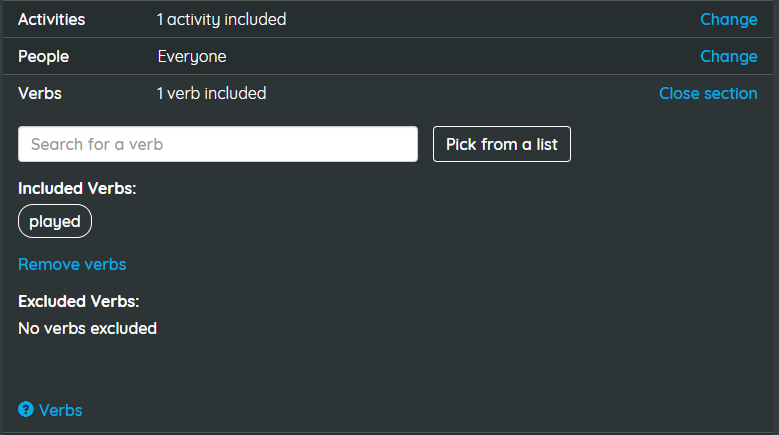
2. Add Activity and Verb filters relating to the content you want to look at. Exactly what these filters are will depend on your data.
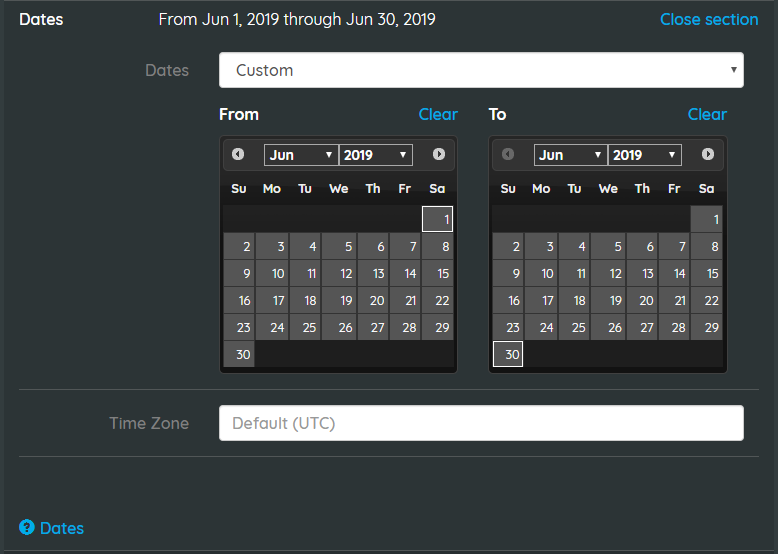
3. Set a data filter to restrict the report to a specific date range, e.g. from the start to the end of a month.
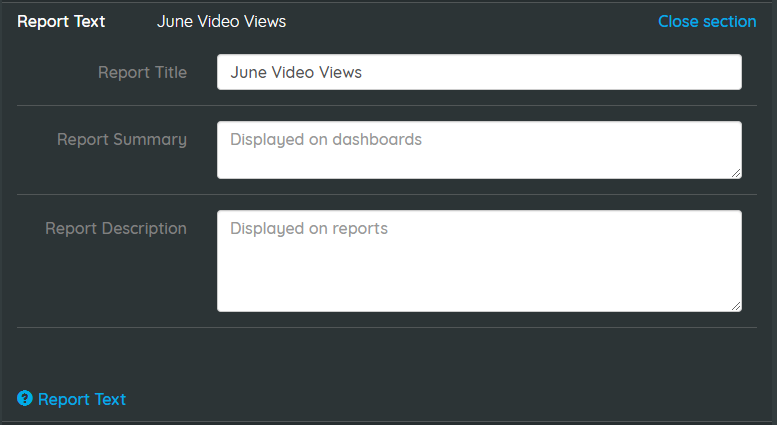
4. Give the report a name.
5. Organize by activity and add the Interaction Count and Person Count measures.
6. Save the report.

You can now create additional reports filtered to different date ranges, and organize and re-size the reports on the dashboard.
4. Use the reports
Don't forget to use the reports you have created to identify the top most popular content, and then take the time to use that information to learn what makes content popular in your org so you can apply those lessons to new content you create and curate.
See Client Spotlight: Caterpillar's 'Kaltura Anomaly Detection' Dashboard for more details.